Open Access
Fig. 1
Download original image
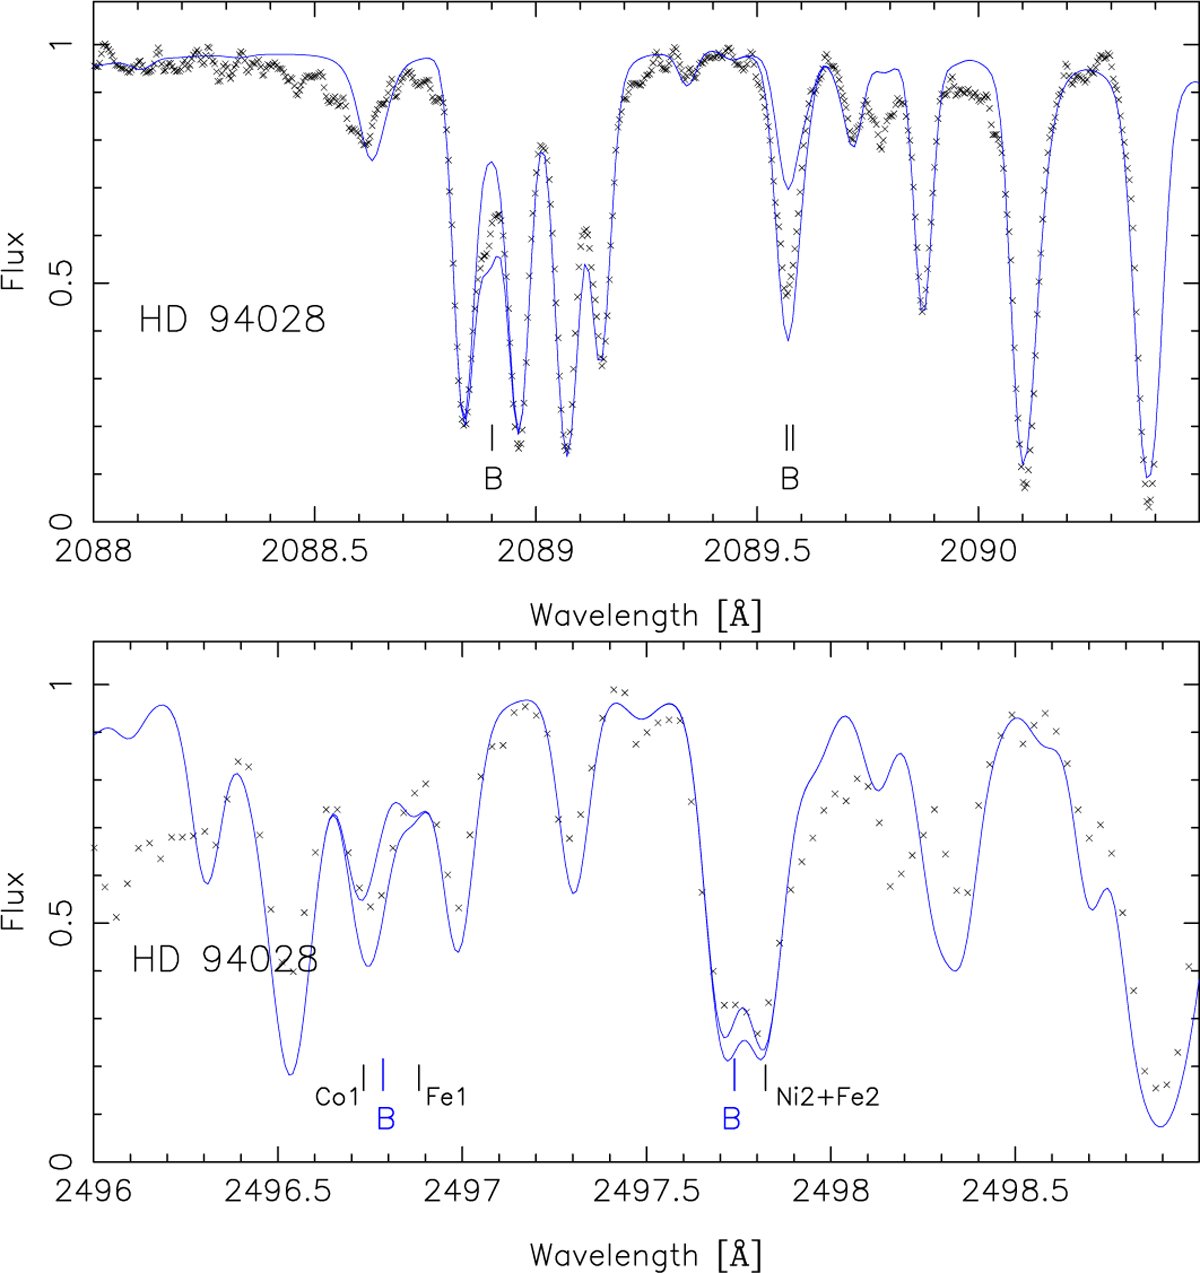
B I 2088.889, 2089.556, and 2089.570Å lines (upper panel) and 2496.7 Å line (lower panel) in HD 94028. In both cases the figure represents 3 Å in the region of the B lines. The synthetic spectra (blue lines) were computed for A(B)=1.0 and A(B)=1.5.
Current usage metrics show cumulative count of Article Views (full-text article views including HTML views, PDF and ePub downloads, according to the available data) and Abstracts Views on Vision4Press platform.
Data correspond to usage on the plateform after 2015. The current usage metrics is available 48-96 hours after online publication and is updated daily on week days.
Initial download of the metrics may take a while.