Fig. 3
Download original image
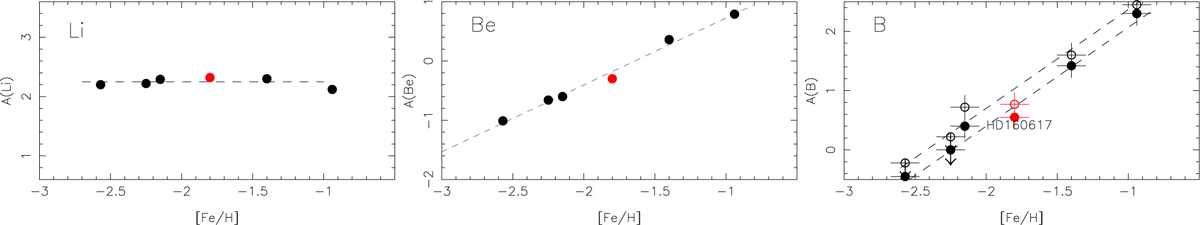
A(Li), A(Be), and A(B) vs [Fe/H] in our sample of stars. The scale is the same in the three figures. In the right panel, for boron, the filled circles represent the LTE values of the B abundance and the open circles the NLTE values computed with SH=0.0. The red dot represents the N-rich star HD 160617. The dashed lines are the linear regression lines.
Current usage metrics show cumulative count of Article Views (full-text article views including HTML views, PDF and ePub downloads, according to the available data) and Abstracts Views on Vision4Press platform.
Data correspond to usage on the plateform after 2015. The current usage metrics is available 48-96 hours after online publication and is updated daily on week days.
Initial download of the metrics may take a while.