Fig. 4
Download original image
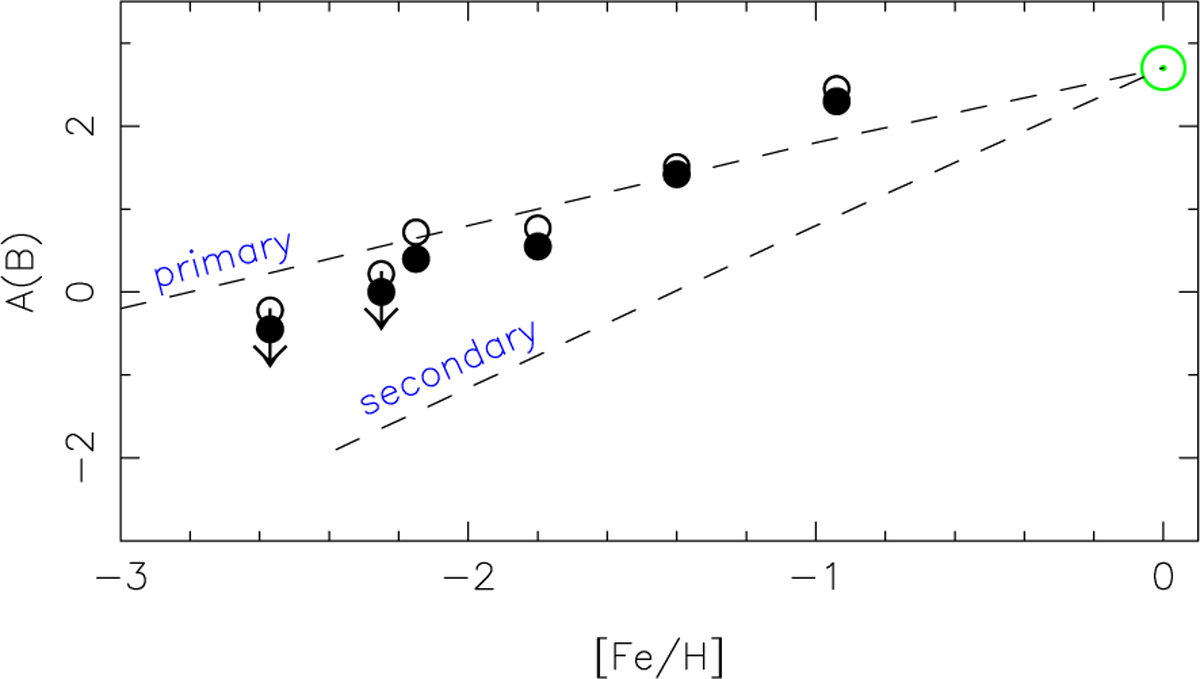
Comparison of the relation log(B/H) vs [Fe/H] for the LTE and the NLTE values of the abundance of B (same symbols as in Fig. 3). The dashed lines represent the predictions of Prantzos (2012) for a primary and a secondary production of B. The position of the Sun is indicated as a green symbol at [Fe/H] = 0.0 and A(B)=2.70 (Lodders et al. 2009; Asplund et al. 2021).
Current usage metrics show cumulative count of Article Views (full-text article views including HTML views, PDF and ePub downloads, according to the available data) and Abstracts Views on Vision4Press platform.
Data correspond to usage on the plateform after 2015. The current usage metrics is available 48-96 hours after online publication and is updated daily on week days.
Initial download of the metrics may take a while.