Fig. 1.
Download original image
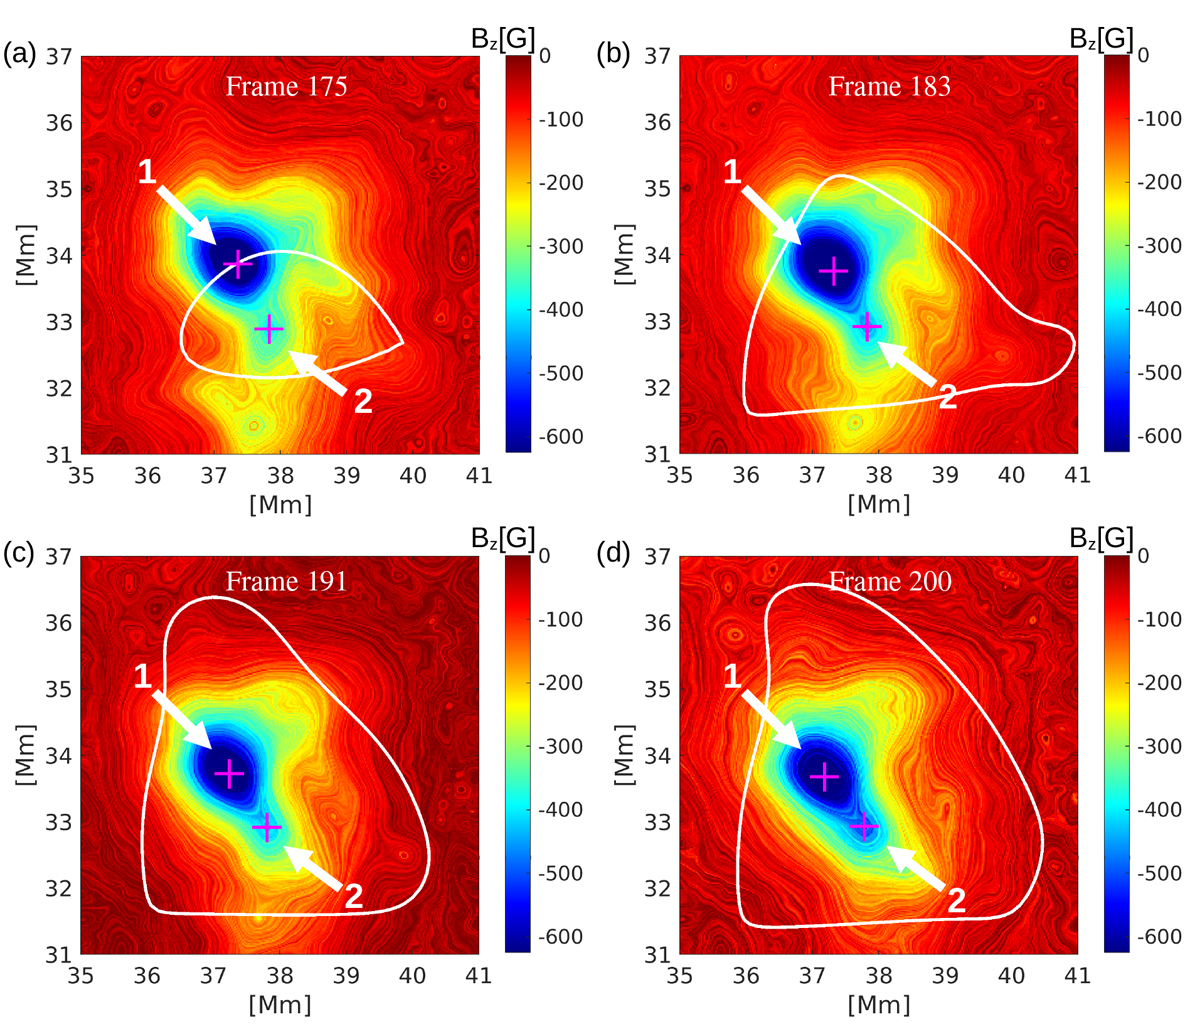
Spatiotemporal inhomogeneous-homogeneous transition of the line-of-sight magnetic field (in G) images superposed by the LIC maps of the horizontal electric current density at a supergranular vertex during a period of vortex expansion of 37.5 min. The white line denotes the objective vortex boundary, the arrows denote the merging plasmoids 1 and 2, and the magenta crosses denote the centers of plasmoid 1 and 2.
Current usage metrics show cumulative count of Article Views (full-text article views including HTML views, PDF and ePub downloads, according to the available data) and Abstracts Views on Vision4Press platform.
Data correspond to usage on the plateform after 2015. The current usage metrics is available 48-96 hours after online publication and is updated daily on week days.
Initial download of the metrics may take a while.