Fig. 1.
Download original image
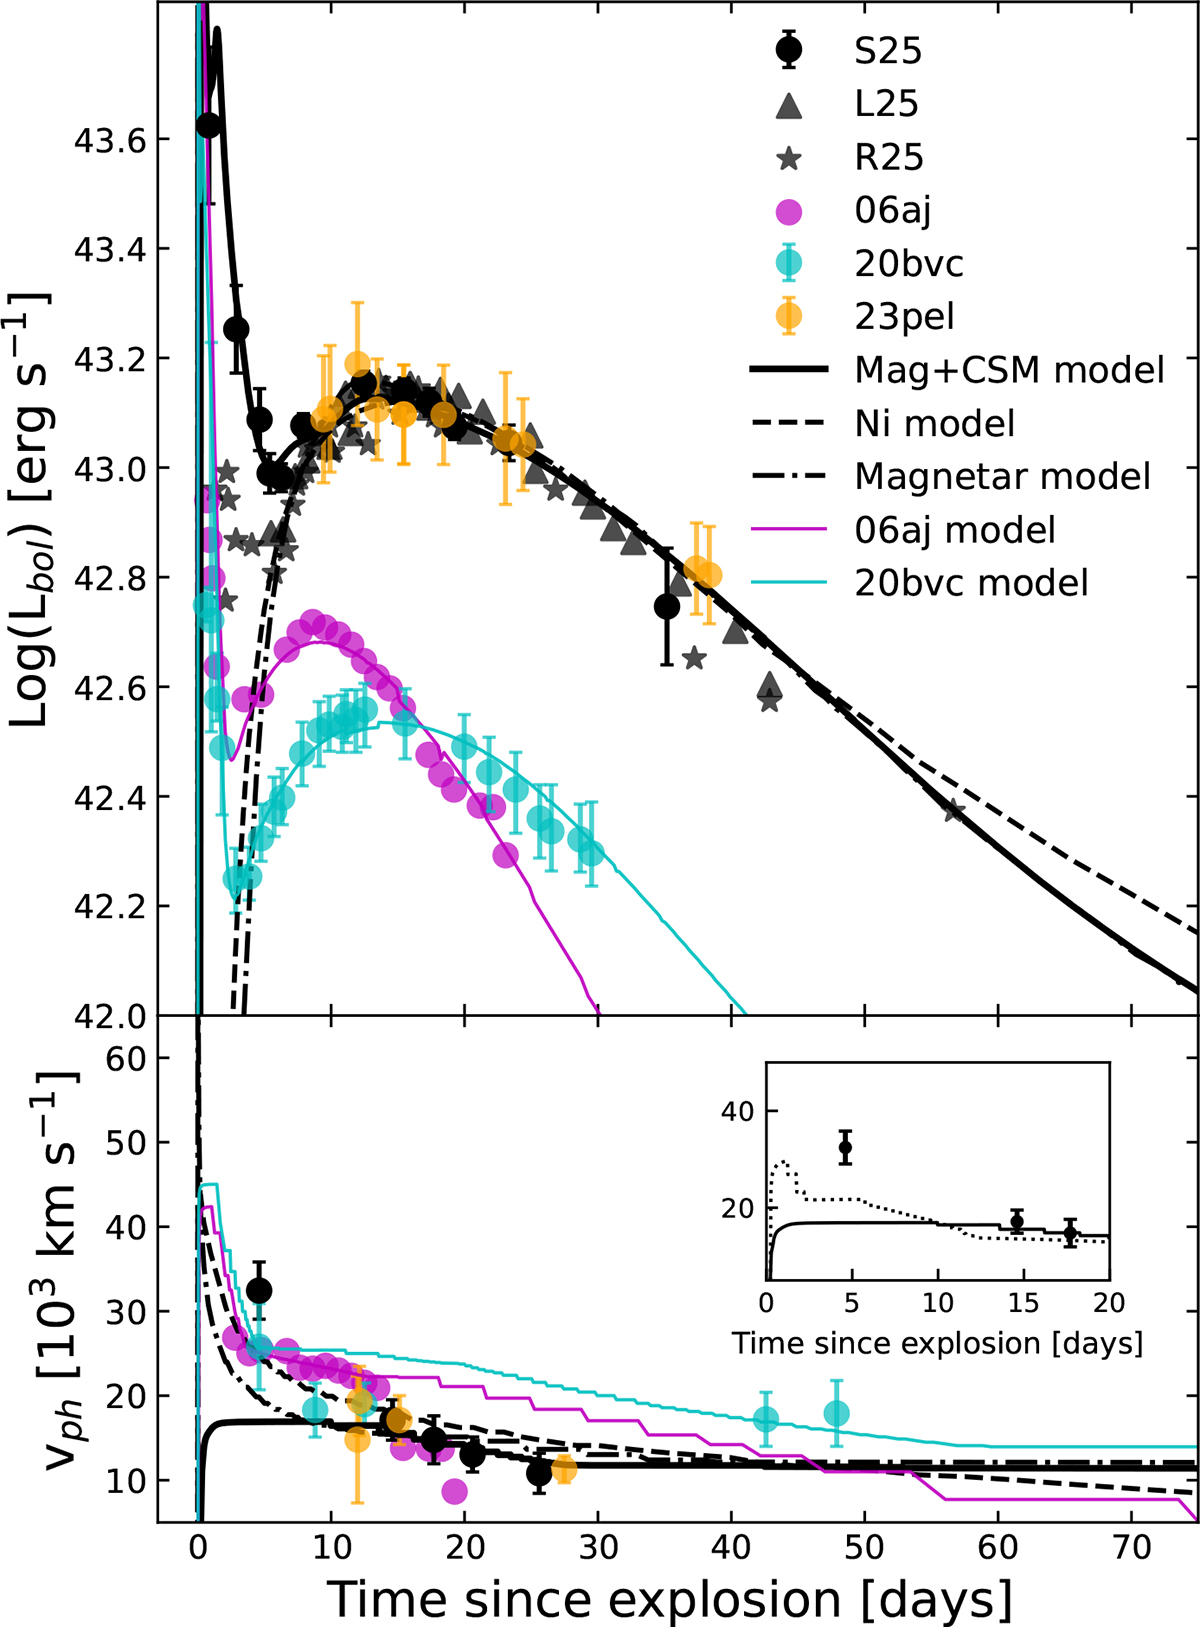
Comparison between SN 2025kg and a set of SNe associated with high-energy emission. Top panel: Bolometric LCs. Bottom panel: Photospheric and FeII line velocities. Black symbols show the available data for SN 2025kg (stars from R25, triangles from L25, and circles from S25). Pink, yellow, and cyan circles correspond to XRF-SN 2006aj, GRB-SN 2023pel, and SN 2020bvc, respectively. The black solid line represents our preferred model for SN 2025kg, which includes CSM interaction, a magnetar and some Ni. Black dashed and dash-dotted lines represent the Ni model and the magnetar model (see Sect. 3 for details). Pink and cyan lines correspond to models of SN 2006aj and SN 2020bvc (Román Aguilar & Bersten 2023, and this work), respectively. Error bars have been included when possible. Inset: A model with a different CSM distribution (dotted line) hints at a closer match at early-time velocities.
Current usage metrics show cumulative count of Article Views (full-text article views including HTML views, PDF and ePub downloads, according to the available data) and Abstracts Views on Vision4Press platform.
Data correspond to usage on the plateform after 2015. The current usage metrics is available 48-96 hours after online publication and is updated daily on week days.
Initial download of the metrics may take a while.