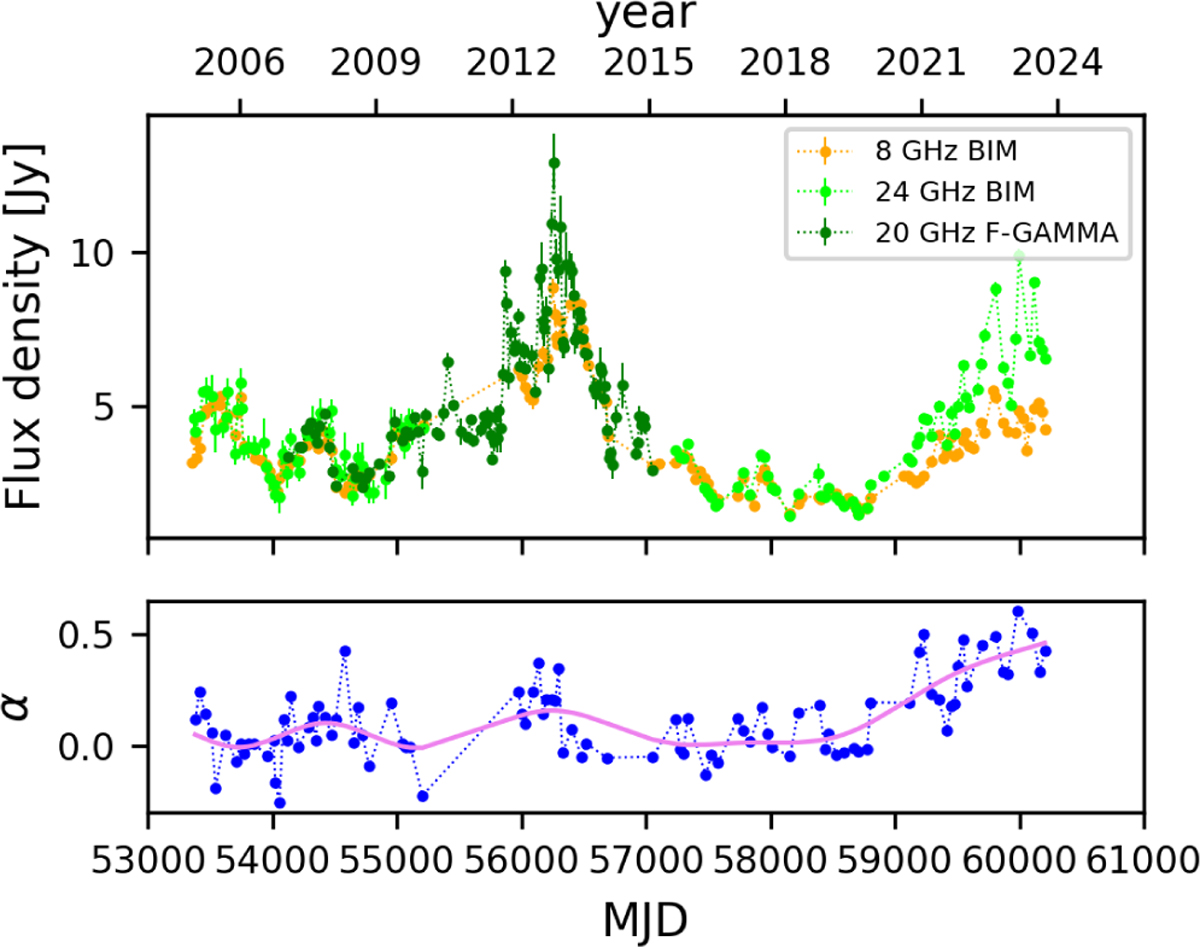
Fig. 2
Download original image
Upper panel: ROBIN light curves of BL Lacertae at 24 and 8 GHz (light green and orange dots, respectively) shown together with the re-scaled (see the main text for the details) 20 GHz ones from the F-GAMMA programme (dark green dots). Lower panel: spectral indices calculated using the combined ROBIN and F-GAMMA data at 20-24 GHz and the ROBIN data at 8 GHz. The clear increasing trend of the spectral index (magenta line) reflects the increasing discrepancy between the light curves in the last 2000 days of observations.
Current usage metrics show cumulative count of Article Views (full-text article views including HTML views, PDF and ePub downloads, according to the available data) and Abstracts Views on Vision4Press platform.
Data correspond to usage on the plateform after 2015. The current usage metrics is available 48-96 hours after online publication and is updated daily on week days.
Initial download of the metrics may take a while.