Fig. 4
Download original image
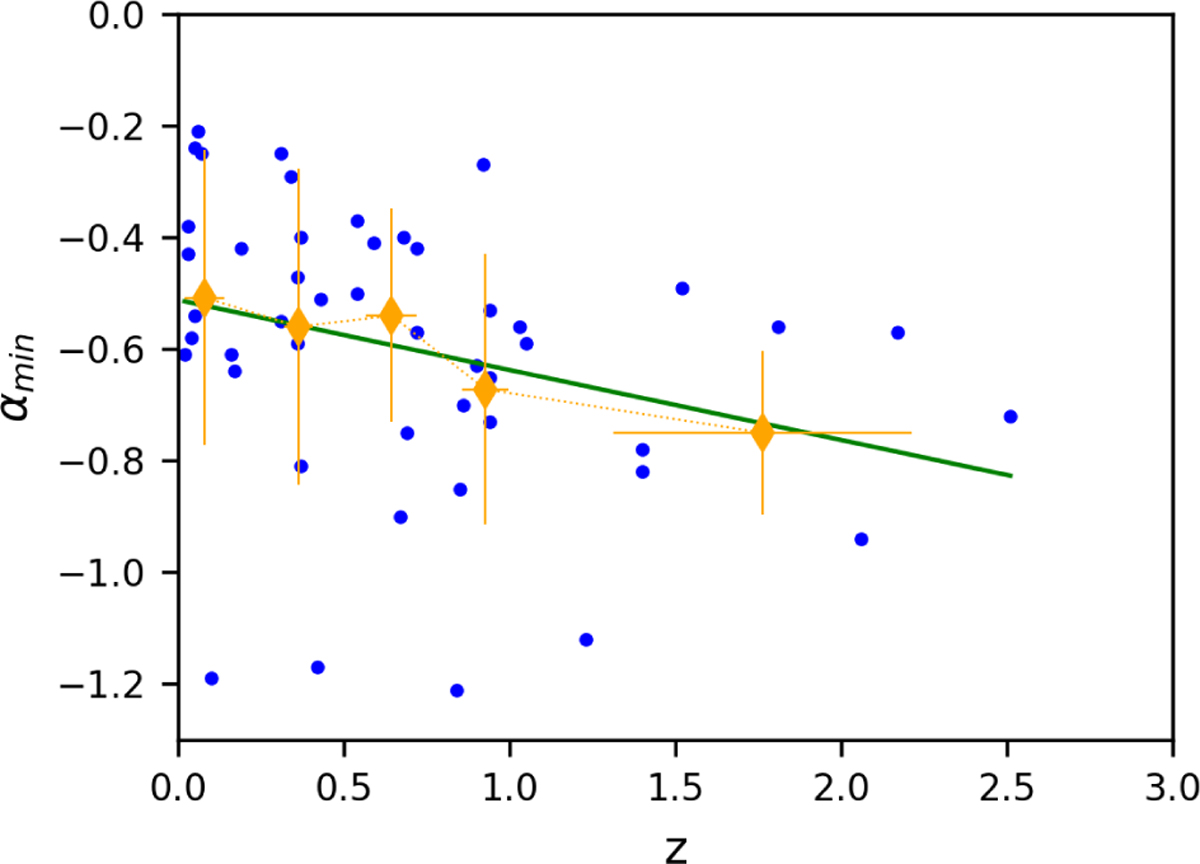
Minimum value of the spectral index calculated over all the available epochs versus redshift. Both a linear regression of the data (green line) and the average calculated over increasingly larger bins (in order to keep the number of contributing points comparable; orange diamonds) indicate a moderate anti-correlation between the two parameters.
Current usage metrics show cumulative count of Article Views (full-text article views including HTML views, PDF and ePub downloads, according to the available data) and Abstracts Views on Vision4Press platform.
Data correspond to usage on the plateform after 2015. The current usage metrics is available 48-96 hours after online publication and is updated daily on week days.
Initial download of the metrics may take a while.