Fig. B.6.
Download original image
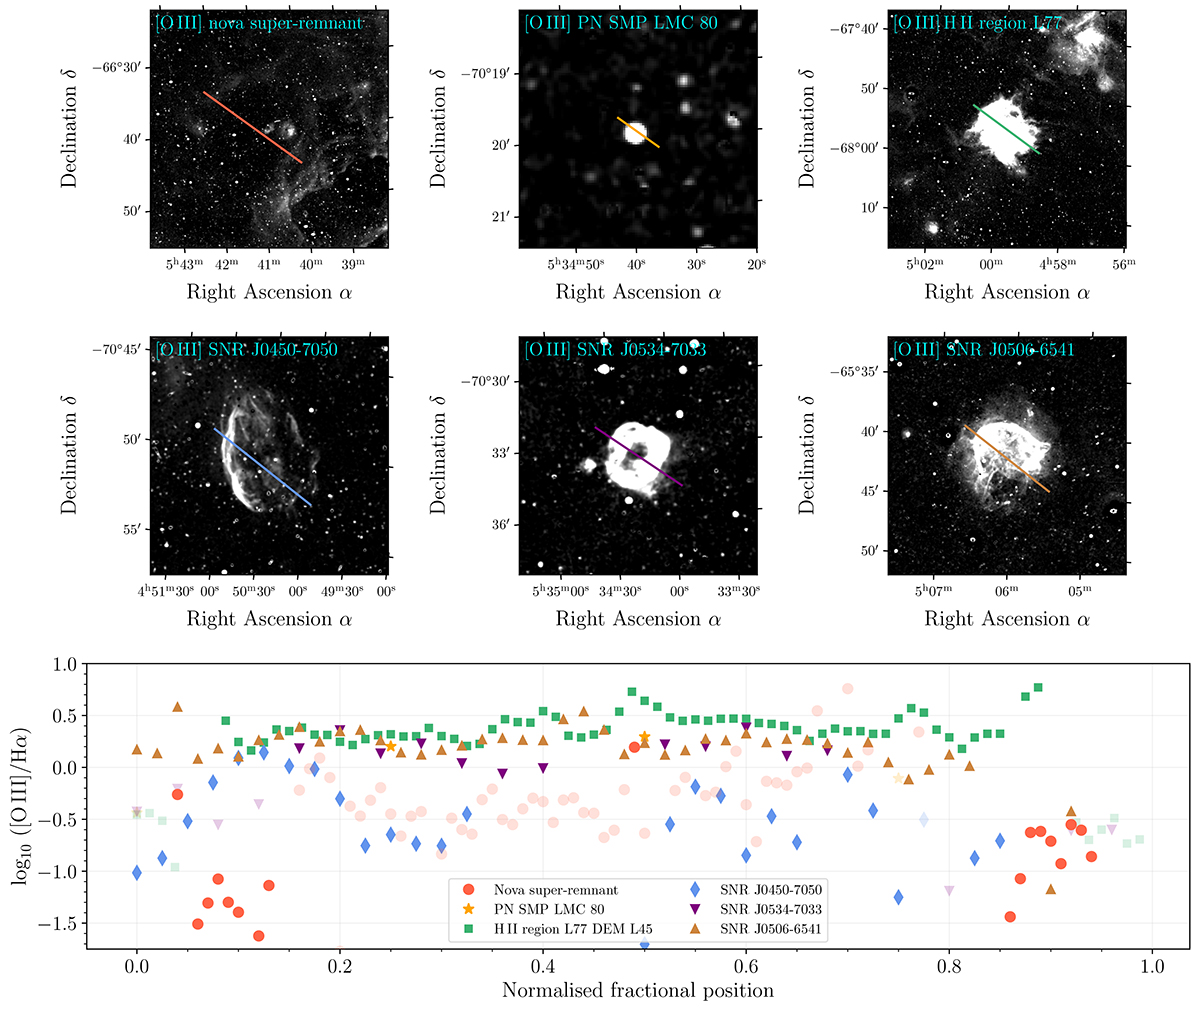
[O III]/Hα ratios for the nova super-remnant, three supernova remnants, an H II region, and a planetary nebula. Top and middle rows: MCELS continuum-subtracted [O III] images of the six sources, each with a different field of view, as follows: ∼33′×33′ for the NSR; ∼3′×3′ for PN SMP LMC 80; ∼40′×40′ for H II region L77 DEM L45; ∼13′×13′ for SNR J0450-7050 (a.k.a. Veliki; Smeaton et al. 2025); ∼10′×10′ for SNR J0534-7033; and ∼20′×20′ for SNR J0506-6541. As detailed in Appendix A.3, slits with different lengths were placed across each structure (with different numbers of apertures) to derive ratios. These slits are shown in each panel. Bottom row: Comparison of the [O III]/Hα ratios for the six sources across the length of the slit with the x−axis normalised to the length of the slit. The nova super-remnant has two distinct groupings of ratios (between ∼0.05 − 0.13 and ∼0.86 − 0.95) corresponding to the northeast and southwest shell with low [O III]/Hα ratios. Two of the supernova remnants (J0534-7033 and J0506-6541) and the H II region have a high [O III]/Hα ratio across their full extent, while the SNR J0450-7050 has a high [O III]/Hα across the eastern edge. The [O III]/Hα ratios from the two apertures across the PN are also high, as expected. The transparent points are from apertures with flux sums ≤0.
Current usage metrics show cumulative count of Article Views (full-text article views including HTML views, PDF and ePub downloads, according to the available data) and Abstracts Views on Vision4Press platform.
Data correspond to usage on the plateform after 2015. The current usage metrics is available 48-96 hours after online publication and is updated daily on week days.
Initial download of the metrics may take a while.