Fig. 1.
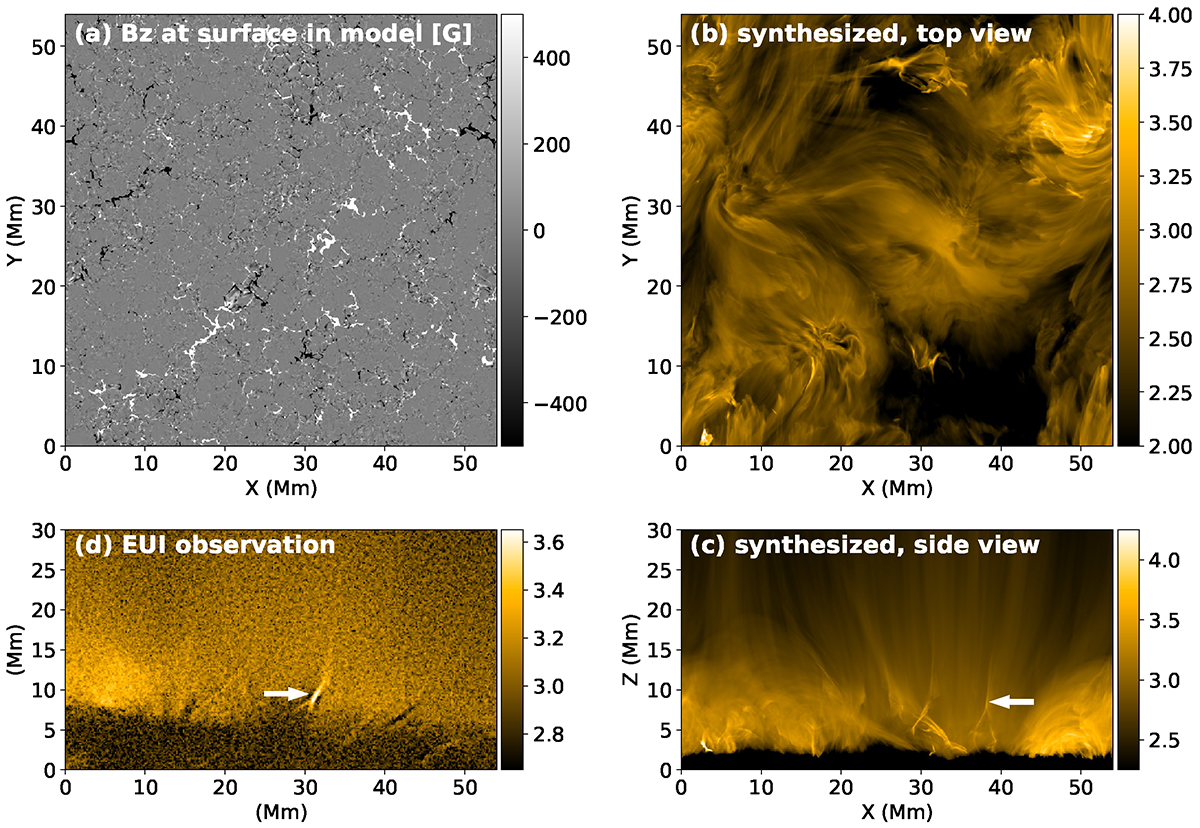
Download original image
Modeled source region of the solar wind and comparison to observations. (a) Vertical component of magnetic field in the photosphere of the 3D MHD model. (b) Coronal emission synthesized from the model in the 174 Å passband integrated along the vertical direction, corresponding to an observation near the center of the solar disk. (c) Same as (b) but integrated along the horizontal (Y) direction, corresponding to an off-limb observations. (d) Coronal observation of the source region of the wind at the limb with HRIEUV on board Solar Orbiter at 174 Å (at 04:49:21 UT on 2022 March 30). The white arrows mark the location of (inverse-Y-type) jets, one example in the observation, and a comparable jet in the model. The field of view of model and observation in (c) and (d) is the same. The intensity maps are shown on a logarithm scale with arbitrary units. An animation is available online.
Current usage metrics show cumulative count of Article Views (full-text article views including HTML views, PDF and ePub downloads, according to the available data) and Abstracts Views on Vision4Press platform.
Data correspond to usage on the plateform after 2015. The current usage metrics is available 48-96 hours after online publication and is updated daily on week days.
Initial download of the metrics may take a while.