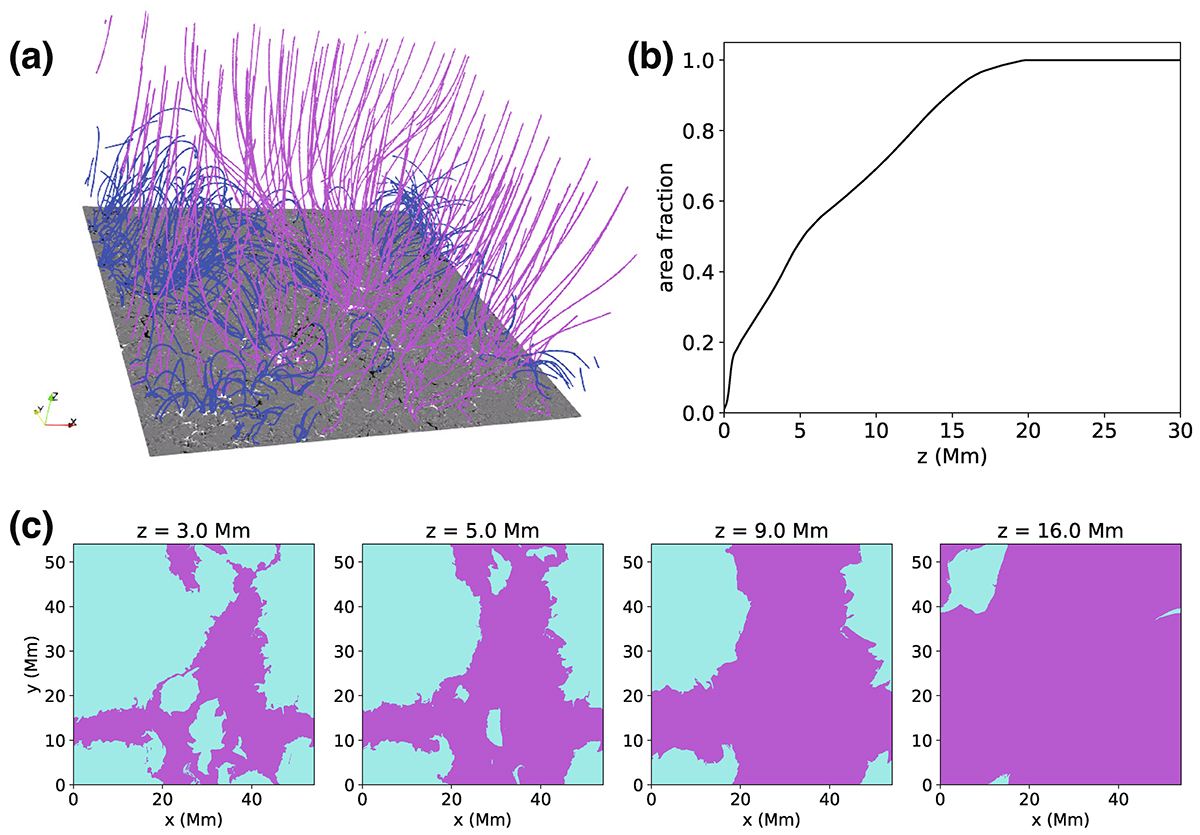
Fig. B.1.
Download original image
Magnetic topology and connectivity in the model. In panel (a) the background image at the bottom shows the vertical component of the magnetic field in the photosphere (black and white indicate opposite polarities). Blue lines represent closed field lines, while purple lines indicate open field lines, i.e. field lines that reach the top of the computational domain and might close back out in the outer solar atmosphere or in the heliosphere. Panel (b) displays the fraction of area in a horizontal slice covered by open magnetic fields as a function of height for the snapshot shown in panel (a). The panels (c) show the magnetic connectivity at heights of 3, 5, 9, and 16 Mm. Blue and purple regions correspond to closed and open magnetic fields, respectively.
Current usage metrics show cumulative count of Article Views (full-text article views including HTML views, PDF and ePub downloads, according to the available data) and Abstracts Views on Vision4Press platform.
Data correspond to usage on the plateform after 2015. The current usage metrics is available 48-96 hours after online publication and is updated daily on week days.
Initial download of the metrics may take a while.