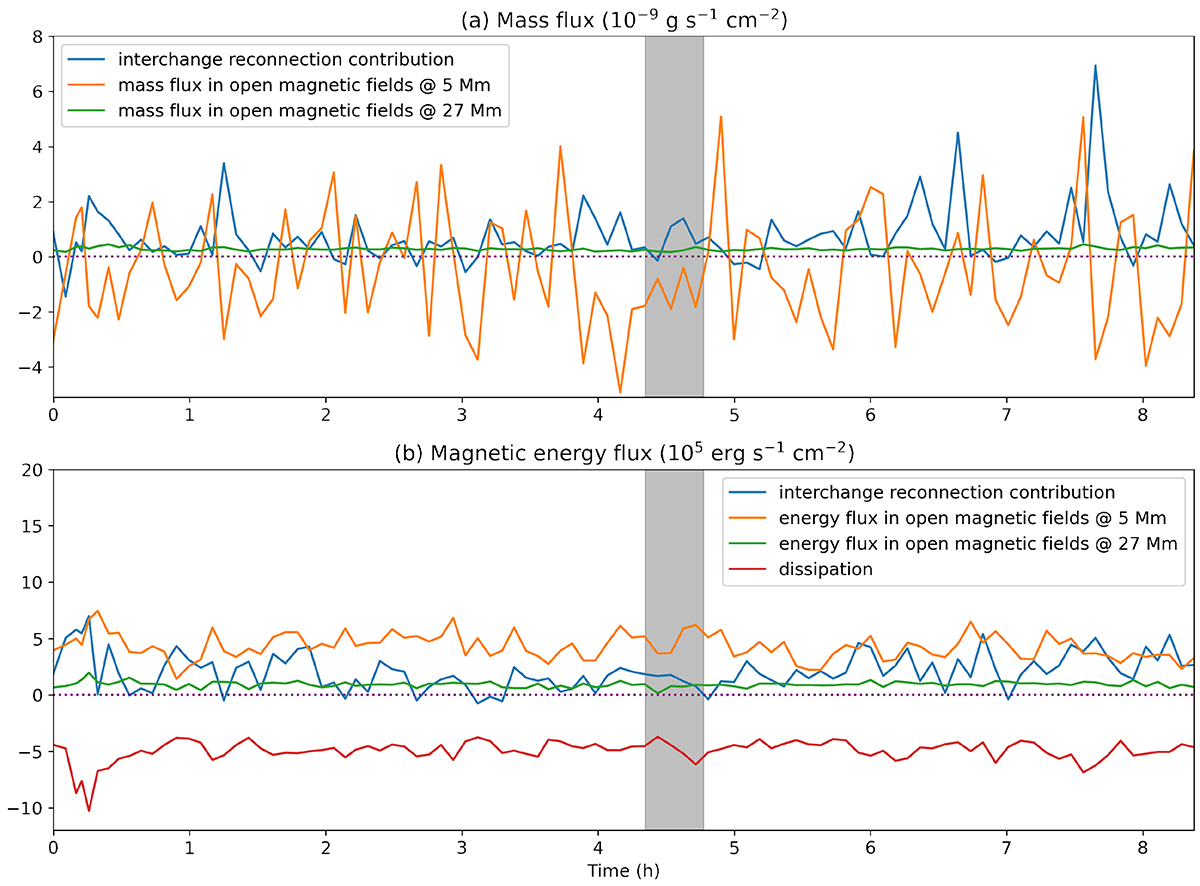
Fig. E.1.
Download original image
Temporal evolution of the contributions to the mass and energy balances. Panel (a) shows the balance for the mass flux as detailed in Eq. E.1. The three curves show the mass flux at the bottom at 5 Mm, ℳ0 (orange), near the top at 27 Mm, ℳ1 (green), and the mass flux through interchange reconnection from closed to open regions, ℳR (blue). Positive values indicate net upward propagating flux (ℳ0, ℳ1) and flux transport from closed to open regions (ℳR). In a similar way panel (b) shows the contribution to the magnetic energy flux balance as detailed in Eq. E.2 with 𝒮0 (orange), 𝒮1 (green), and 𝒮R (blue) indicating the fluxes at the top, bottom and through interchange reconnection, respectively. Also work done by the Lorenz force and dissipation change the magnetic energy. Hence, we add the respective term 𝒮D (red) from Eq. E.2 to this plot, with negative values indicating a loss of magnetic energy. The purple dotted lines in both panels indicate zero flux. The grey-shaded region indicates the period shown in Fig. E.2.
Current usage metrics show cumulative count of Article Views (full-text article views including HTML views, PDF and ePub downloads, according to the available data) and Abstracts Views on Vision4Press platform.
Data correspond to usage on the plateform after 2015. The current usage metrics is available 48-96 hours after online publication and is updated daily on week days.
Initial download of the metrics may take a while.