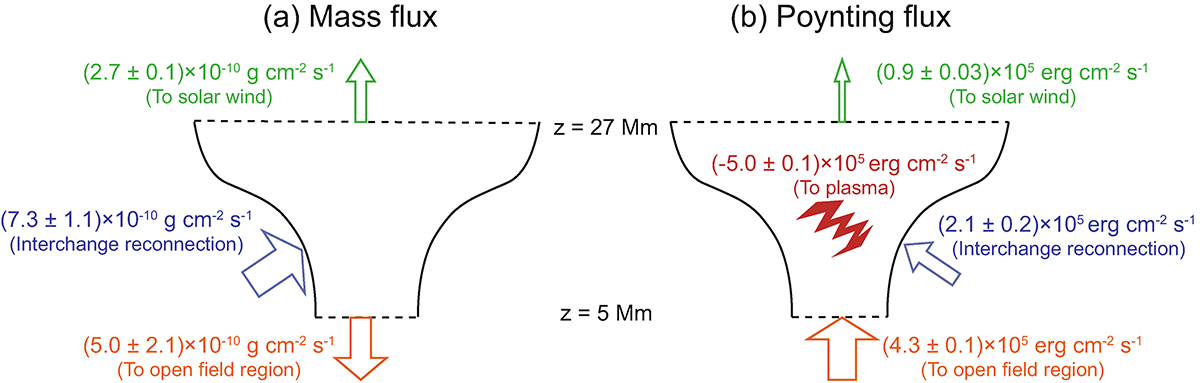
Fig. E.3.
Download original image
Schematic illustration of mass and energy flux transport in open magnetic fields. The values of mass and energy flux quoted here are the long-term averages of the evolution shown in Fig. E.1 for the different terms in Eq. E.1 and Eq. E.2. The uncertainties quoted here represent the temporal variation across multiple snapshots of the model. Panel (a) shows the mass flux at different heights (⟨ℳ0⟩ and ⟨ℳ1⟩) and contributions from interchange reconnection (⟨ℳR⟩). The widths of the arrows are indicative for the magnitude of the flux. Panel (b) presents the Poynting flux at different heights (⟨𝒮0⟩ and ⟨𝒮1⟩), with contributions from interchange reconnection (⟨𝒮R⟩) and changes due to Lorentz force work and Joule heating (⟨𝒮D⟩). The widths of the arrows are roughly scaled to illustrate relative magnitudes of the fluxes.
Current usage metrics show cumulative count of Article Views (full-text article views including HTML views, PDF and ePub downloads, according to the available data) and Abstracts Views on Vision4Press platform.
Data correspond to usage on the plateform after 2015. The current usage metrics is available 48-96 hours after online publication and is updated daily on week days.
Initial download of the metrics may take a while.