Open Access
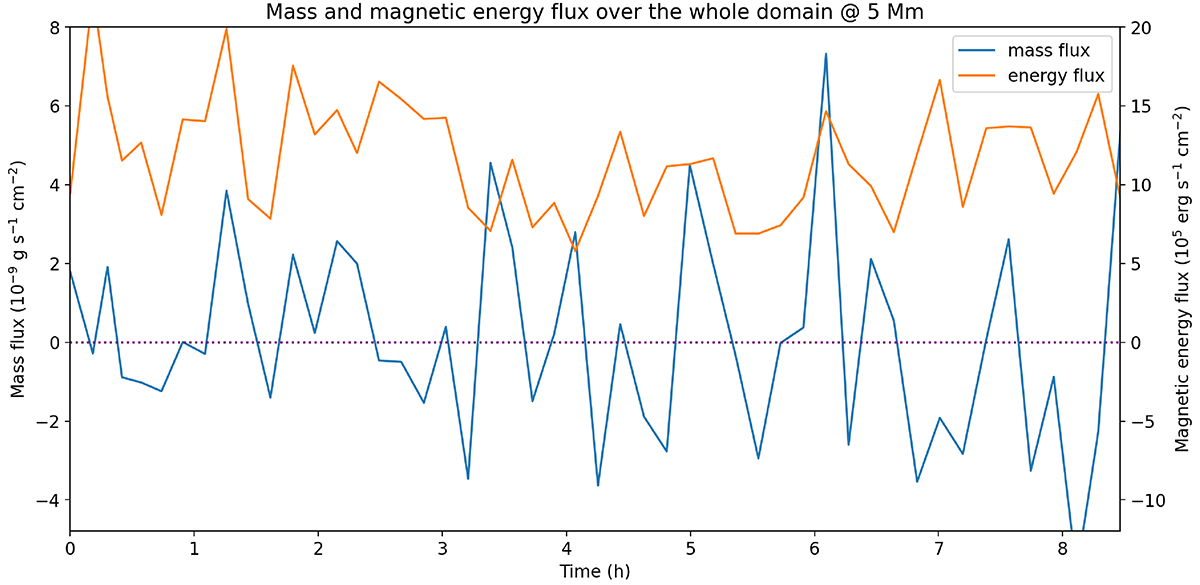
Fig. E.4.
Download original image
Temporal evolution of mass (blue) and energy flux (orange) over the whole domain at 5 Mm for the low-cadence dataset. Positive values correspond to net upward propagating flux. The purple dotted lines indicate zero flux.
Current usage metrics show cumulative count of Article Views (full-text article views including HTML views, PDF and ePub downloads, according to the available data) and Abstracts Views on Vision4Press platform.
Data correspond to usage on the plateform after 2015. The current usage metrics is available 48-96 hours after online publication and is updated daily on week days.
Initial download of the metrics may take a while.