Fig. 1.
Download original image
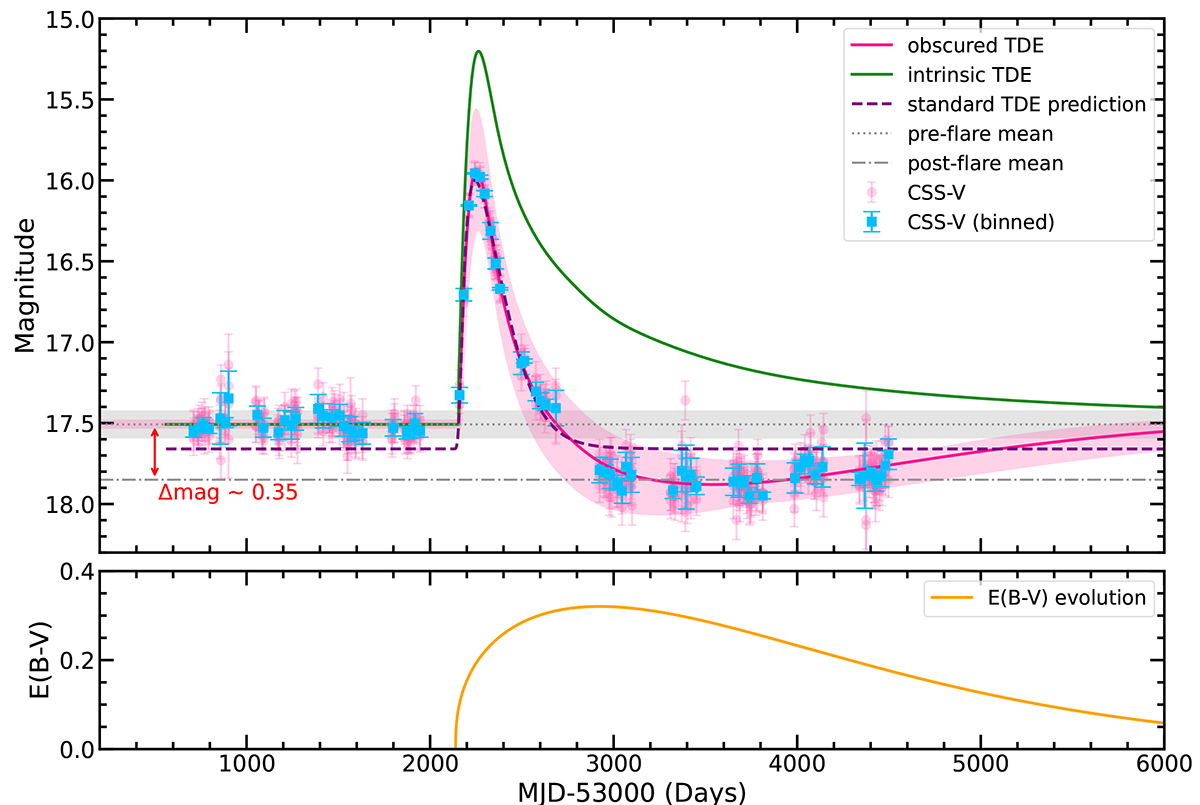
Top: Raw single-exposure CSS V-band data are plotted in pink. The binned data are plotted in blue and grouped in sets of 15 consecutive points. The best description by the obscured TDE model is shown as a solid pink line, with the corresponding confidence bands (shaded pink area) determined by uncertainties of the model parameters. For comparison, the solid green line displays the intrinsic TDE light curve recovered by removing the obscured component, while the dashed purple line shows the conventional theoretical TDE model prediction assuming no obscuration. The dashed black line and the gray band show the mean and standard deviation of the pre-flare magnitudes, respectively, while the dash-dotted gray shows the post-flare mean magnitude, ∼0.35 mag fainter (red arrow). Bottom: Time evolution of the color excess E(B–V) determined by the best-fit parameters of the obscured TDE model.
Current usage metrics show cumulative count of Article Views (full-text article views including HTML views, PDF and ePub downloads, according to the available data) and Abstracts Views on Vision4Press platform.
Data correspond to usage on the plateform after 2015. The current usage metrics is available 48-96 hours after online publication and is updated daily on week days.
Initial download of the metrics may take a while.