Open Access
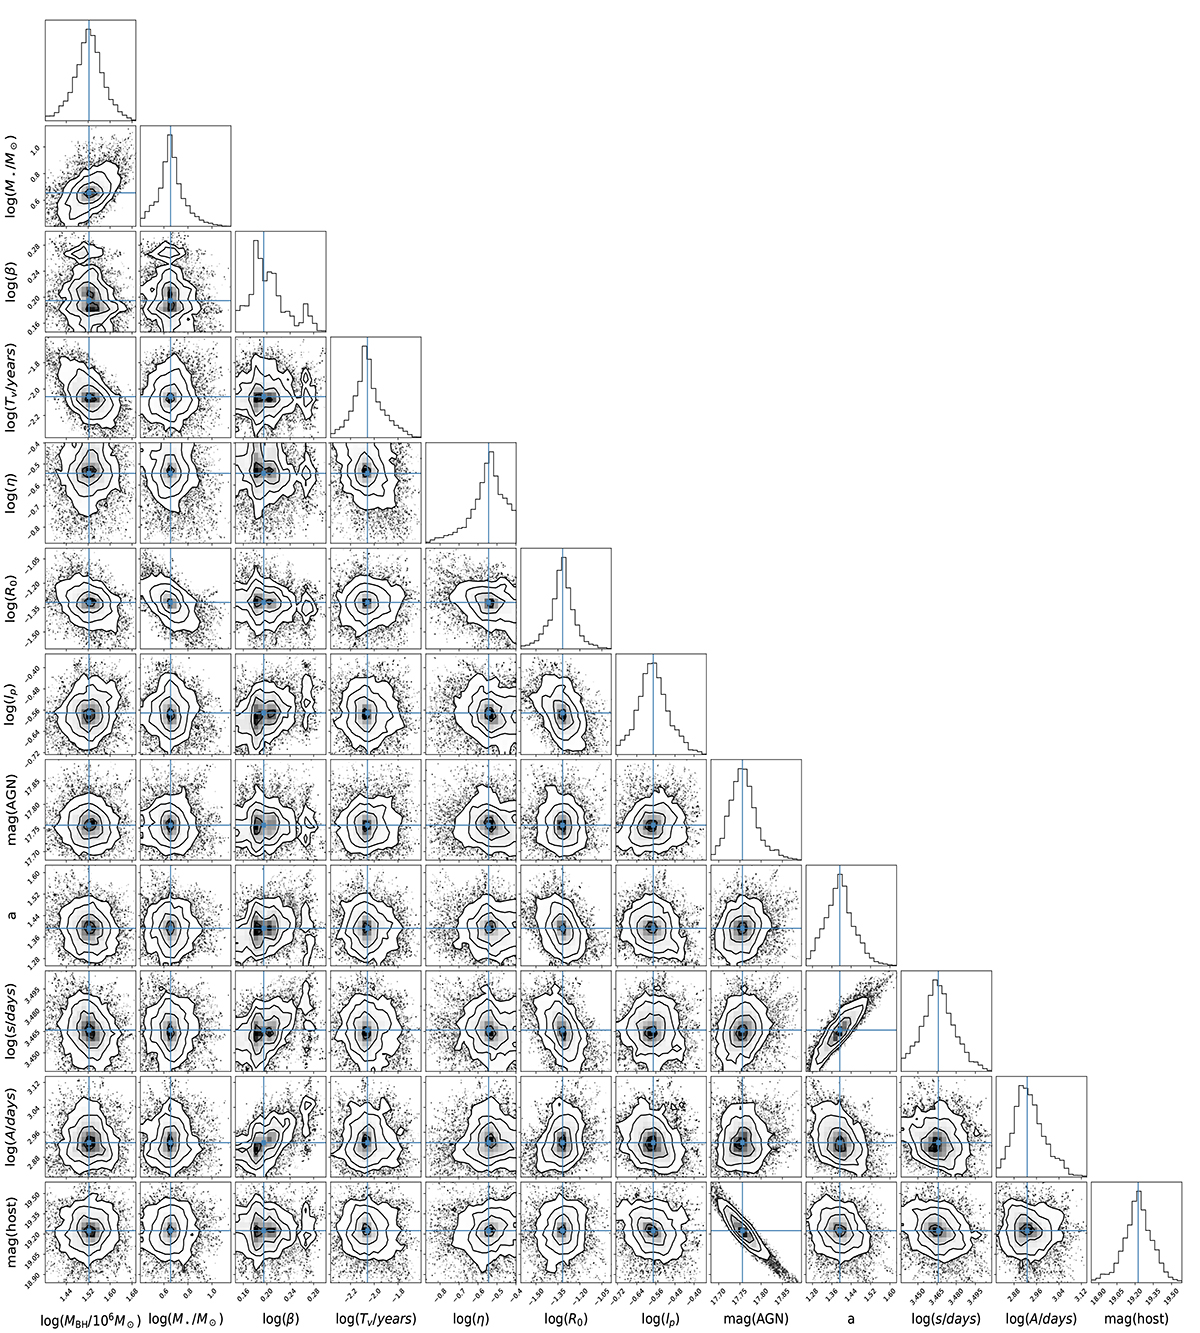
Fig. A.1.
Download original image
Posterior distributions of the TDE with obscured model parameters derived from the MCMC technique. In each panel, the three circles from outer to inner represent 3σ, 2σ, and 1σ confidence levels and the blue dot in the center of each contour marks the position of the best-fit parameter.
Current usage metrics show cumulative count of Article Views (full-text article views including HTML views, PDF and ePub downloads, according to the available data) and Abstracts Views on Vision4Press platform.
Data correspond to usage on the plateform after 2015. The current usage metrics is available 48-96 hours after online publication and is updated daily on week days.
Initial download of the metrics may take a while.