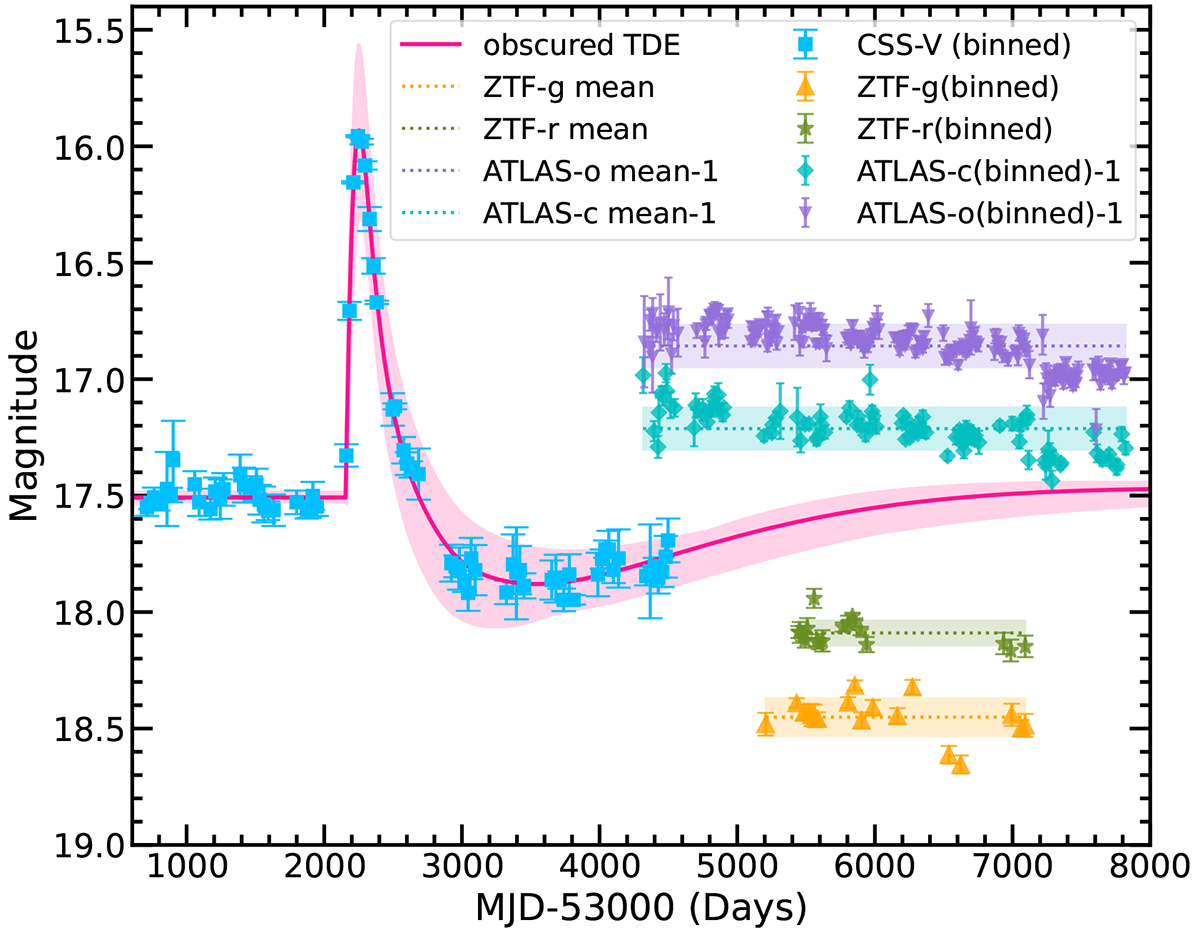
Fig. C.1.
Download original image
Same as Fig. 1 but showing follow-up observations from other projects, as indicated in the legend at the top right. All data points are shown after 15-day binning. The dashed line and corresponding shaded region of the same color indicate the mean value and standard deviations of the light curve. For clarity, the ATLAS data points, as well as the corresponding mean and standard deviation, have been offset by −1 mag.
Current usage metrics show cumulative count of Article Views (full-text article views including HTML views, PDF and ePub downloads, according to the available data) and Abstracts Views on Vision4Press platform.
Data correspond to usage on the plateform after 2015. The current usage metrics is available 48-96 hours after online publication and is updated daily on week days.
Initial download of the metrics may take a while.