Open Access
Fig. 1.
Download original image
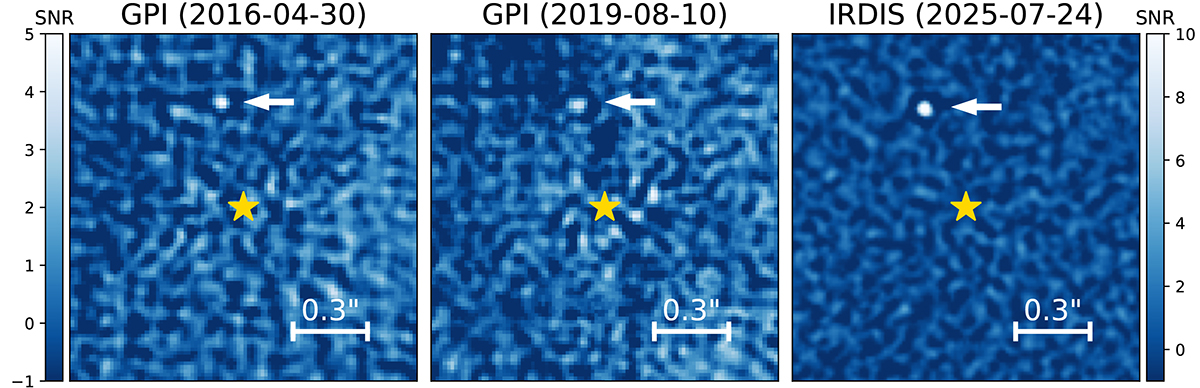
S/N maps produced from PACO in the three epochs. The image scale is shown in the lower right corner, and the position of the planet is indicated by an arrow. The left color bar refers to the two GPI maps.
Current usage metrics show cumulative count of Article Views (full-text article views including HTML views, PDF and ePub downloads, according to the available data) and Abstracts Views on Vision4Press platform.
Data correspond to usage on the plateform after 2015. The current usage metrics is available 48-96 hours after online publication and is updated daily on week days.
Initial download of the metrics may take a while.