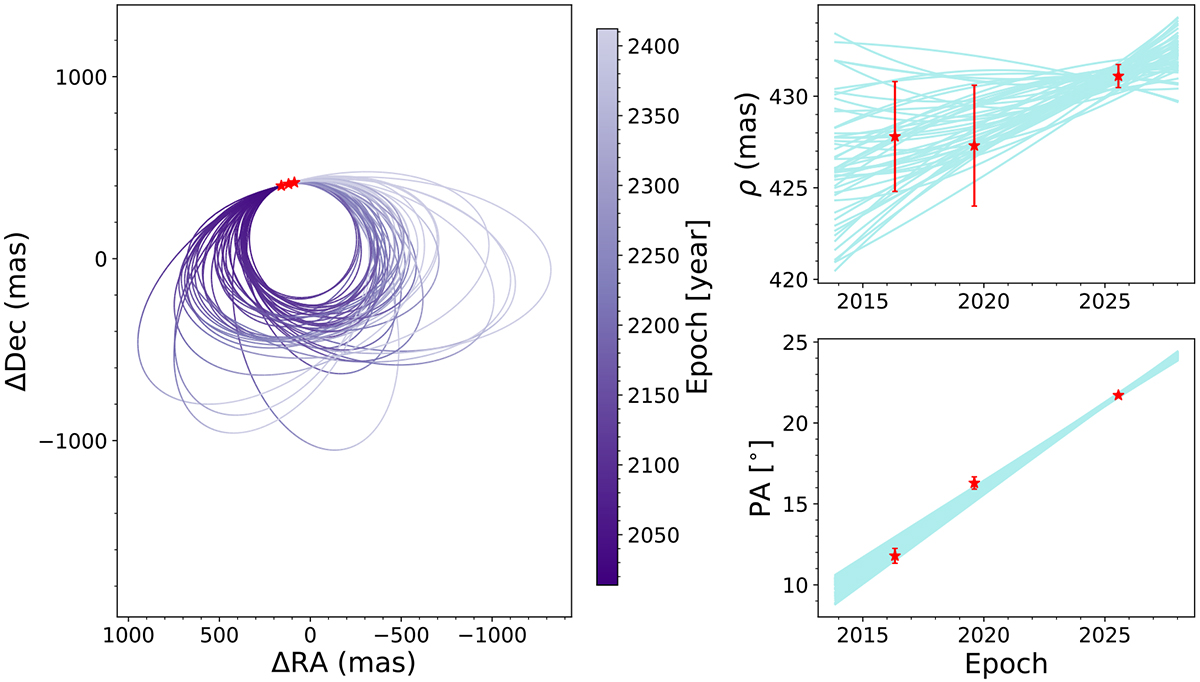
Fig. 2.
Download original image
Orbits of HD 143811 b. Left: 50 randomly drawn accepted orbits from the OFTI posterior plotted in their sky projection. The measured astrometry is plotted in red from GPI (2016 and 2019) and SPHERE/IRDIS (2025) data. Right: same randomly drawn accepted orbits plotted as a function of time. The red dots show the measured astrometry and associated errors.
Current usage metrics show cumulative count of Article Views (full-text article views including HTML views, PDF and ePub downloads, according to the available data) and Abstracts Views on Vision4Press platform.
Data correspond to usage on the plateform after 2015. The current usage metrics is available 48-96 hours after online publication and is updated daily on week days.
Initial download of the metrics may take a while.