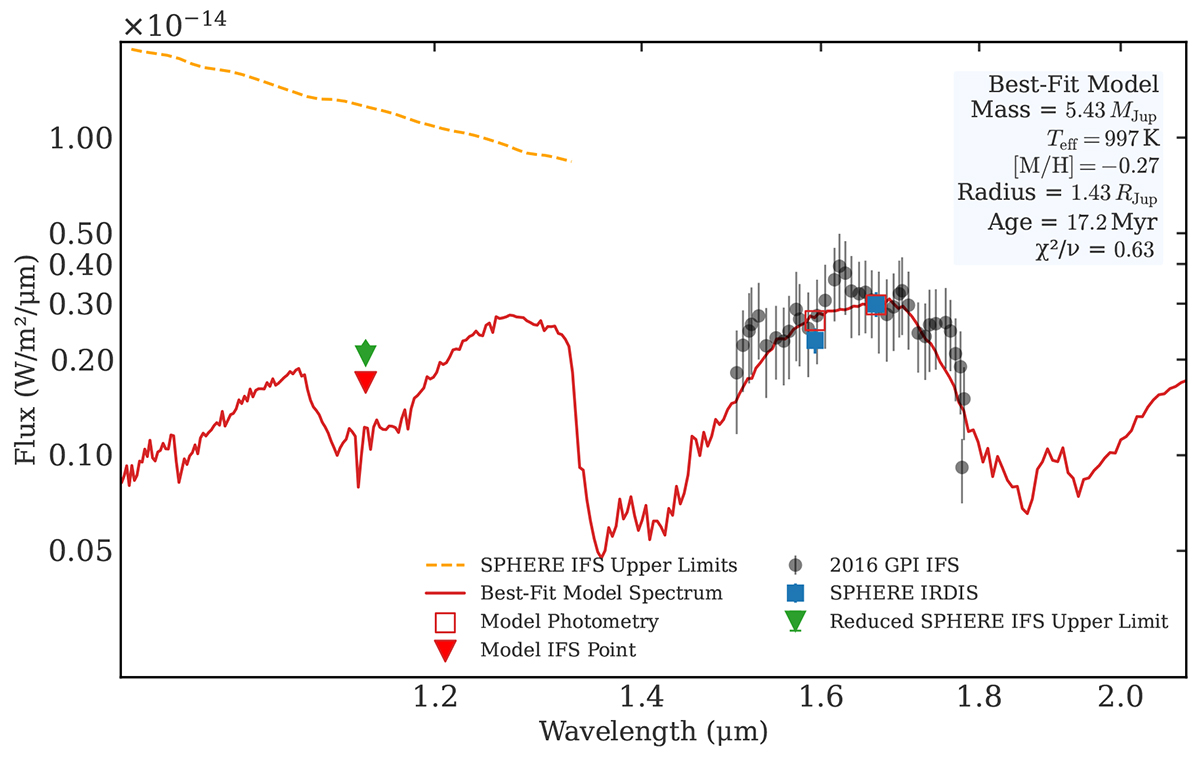
Fig. 3.
Download original image
Spectrophotometry of the planet, normalized to d = 10 pc, compared to the best-fit model from HADES (red line). The black circles show the GPI spectrum, the blue square shows SPHERE photometry, and the green arrow indicates the SPHERE-IFS 5σ upper limit (all with 1σ errors). The orange line shows 5σ IFS upper limits in individual λ slices. The predicted photometric points are shown with red markers.
Current usage metrics show cumulative count of Article Views (full-text article views including HTML views, PDF and ePub downloads, according to the available data) and Abstracts Views on Vision4Press platform.
Data correspond to usage on the plateform after 2015. The current usage metrics is available 48-96 hours after online publication and is updated daily on week days.
Initial download of the metrics may take a while.