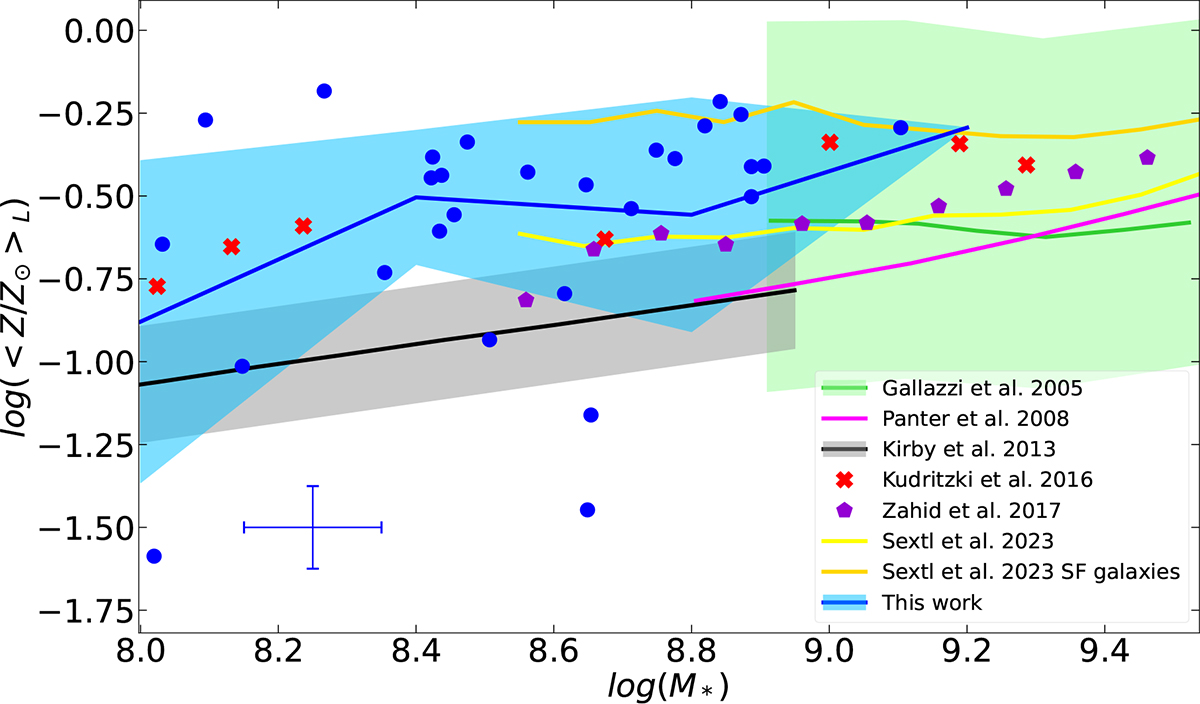
Fig. 10.
Download original image
Current stellar mass and mean stellar metallicity weighted by light relation. In blue circles are our result with the mean error at the bottom. The green line is from Gallazzi et al. (2005), the magenta line is from Panter et al. (2008), the black line is from Kirby et al. (2013), red Xs are from Kudritzki et al. (2016), violet pentagons are from Zahid et al. (2017), and the orange and yellow lines are the star-forming regions and the mean of all galaxies from Sextl et al. (2023). The blue dots are the results from our work and the blue cross at the bottom represents the mean error of our analysis.
Current usage metrics show cumulative count of Article Views (full-text article views including HTML views, PDF and ePub downloads, according to the available data) and Abstracts Views on Vision4Press platform.
Data correspond to usage on the plateform after 2015. The current usage metrics is available 48-96 hours after online publication and is updated daily on week days.
Initial download of the metrics may take a while.