Fig. 1.
Download original image
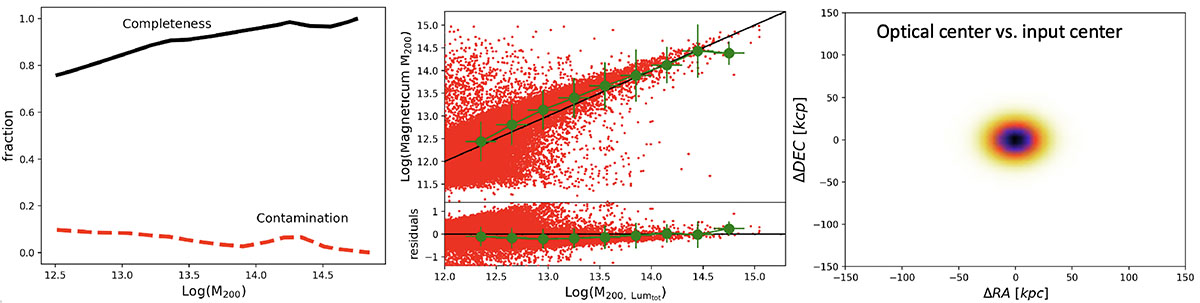
Left panel: Completeness and contamination of the optical group catalog based on the Magneticum mock galaxy catalog. Central panel top: Comparison between the input halo mass M200 and the group mass proxy based on the total luminosity scaled through the scaling relation of Popesso et al. (2005). The solid line indicates the 1:1 relation. The green symbols indicate the mean M200 obtained in bins of 0.3 dex width of Mlum, whilst the error bar indicates the dispersion. Central panel bottom: Residuals Δ = log(Mlum)−log(M200) of the individual (red) points and the mean values (green symbols). Right panel: Difference in ΔRA and ΔDec, estimated in kiloparsec, between the center of the detected optical group and the center of the input halo.
Current usage metrics show cumulative count of Article Views (full-text article views including HTML views, PDF and ePub downloads, according to the available data) and Abstracts Views on Vision4Press platform.
Data correspond to usage on the plateform after 2015. The current usage metrics is available 48-96 hours after online publication and is updated daily on week days.
Initial download of the metrics may take a while.