Fig. 2.
Download original image
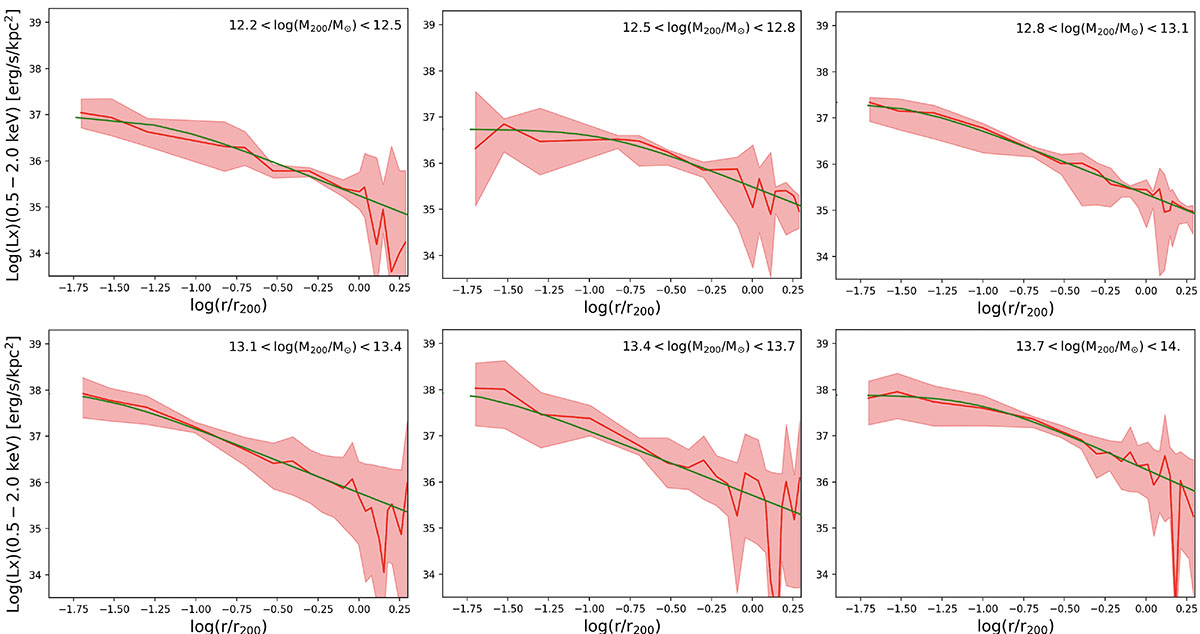
Average X-ray surface brightness profiles of groups in different halo mass bins. The mass bin is indicated in each panel. The mass increases from left to right. The red solid line shows the observed profile, while the shaded regions indicate the 1σ uncertainty estimated via bootstrapping. The green solid line shows the best-fit beta profile with a fixed slope of 0.5.
Current usage metrics show cumulative count of Article Views (full-text article views including HTML views, PDF and ePub downloads, according to the available data) and Abstracts Views on Vision4Press platform.
Data correspond to usage on the plateform after 2015. The current usage metrics is available 48-96 hours after online publication and is updated daily on week days.
Initial download of the metrics may take a while.