Fig. 3.
Download original image
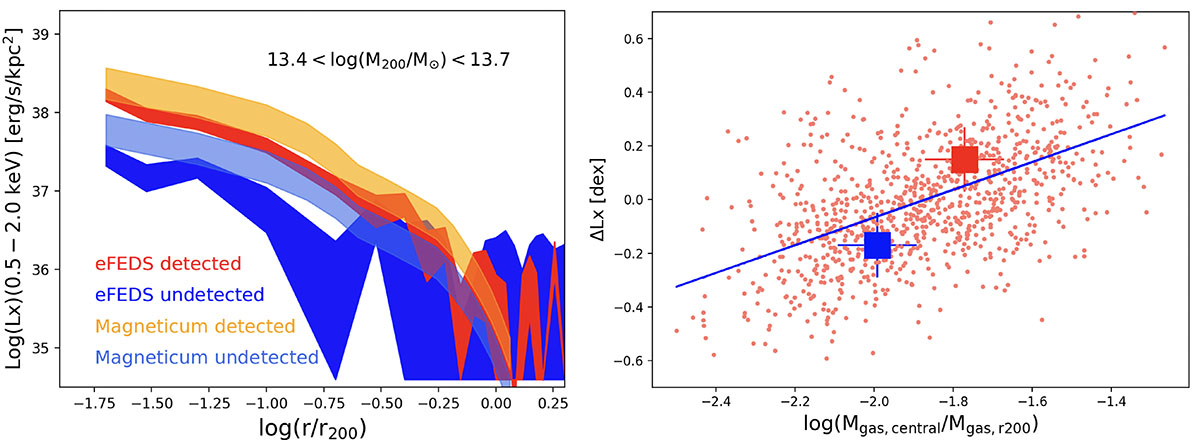
Left panel: Comparison of the stacked profiles of eFEDS-detected groups (red-shaded region) and undetected groups (blue-shaded region) within a halo mass bin of 13.4 < log(M200/M⊙) < 13.7. Additionally, the orange-shaded region shows the stacked profiles from mock eRASS:4 observations for the eSASS-detected groups, while the light-blue-shaded region indicates the mock R11 undetected groups within the same halo mass bin. Right panel: Correlation between the residuals (ΔLX) from the Lovisari et al. (2015)LX, 500 − M500 relation and gas mass concentration within the same halo mass bin as in the left panel. The Lovisari et al. (2015) relation has been chosen because it represents a very good fit for Magneticum (Marini et al. 2024; Popesso et al. 2025). Gas concentration is estimated as the ratio of gas mass within 0.1r200 to the total mass within r200. The red points represent predictions from the Magneticum simulation, while the blue line is the linear best fit. The squares correspond to ratios measured from the observed stacked profiles in the left panel, with the red square indicating the location of detected eFEDS groups and the blue square showing the result for undetected groups.
Current usage metrics show cumulative count of Article Views (full-text article views including HTML views, PDF and ePub downloads, according to the available data) and Abstracts Views on Vision4Press platform.
Data correspond to usage on the plateform after 2015. The current usage metrics is available 48-96 hours after online publication and is updated daily on week days.
Initial download of the metrics may take a while.