Fig. 6.
Download original image
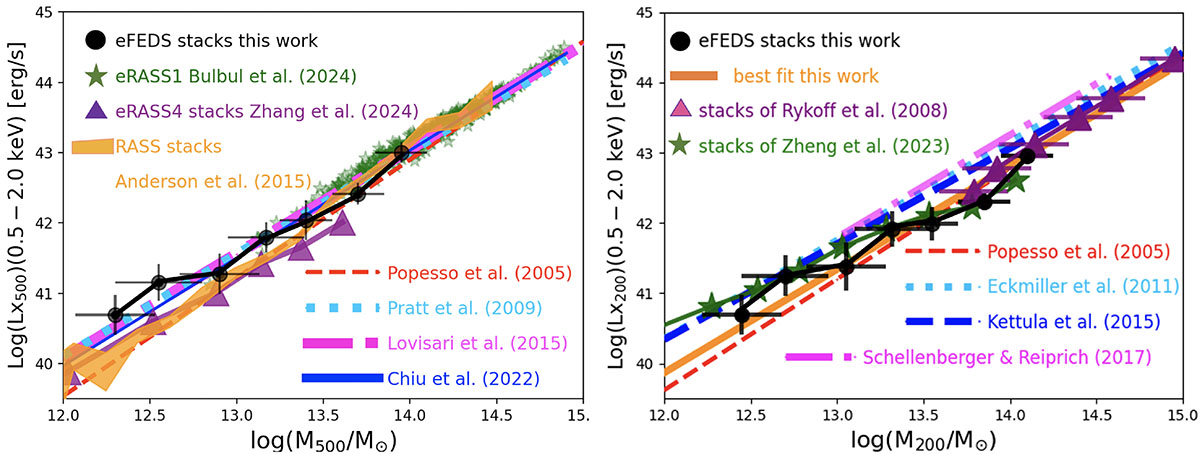
Left panel: LX, 500 − M500 relation. The black points represent the relation derived by integrating the X-ray surface brightness profiles from Fig. 2 within r500. For the highest mass bin, the relation is determined by integrating the average X-ray surface brightness profile from the detections reported by Liu et al. (2022b). The green stars correspond to the eRASS:1 cluster sample from Bulbul et al. (2024), while the purple triangles indicate the stacking results from Zhang et al. (2024b). The orange-shaded region shows the results of the stacking of Anderson et al. (2015). The red dashed line shows the relation from Popesso et al. (2005), the cyan dotted line represents the relation from Pratt et al. (2009), the magenta dash-dotted line corresponds to the relation from Lovisari et al. (2015), and the blue solid line illustrates the relation from Chiu et al. (2022). Right panel: The LX, 200 − M200 relation. Similar to the left panel, the black points represent the relation obtained by integrating the X-ray surface brightness profiles from Fig. 2, this time within r200. For the highest mass bin, the relation is derived by integrating the average X-ray surface brightness profile from the detections in Liu et al. (2022b). The purple triangles indicate the stacking results from Rykoff et al. (2008b). The green stars show the results from the stacking analysis of Zheng et al. (2023). The orange solid line indicates the best fit of this work at M200 larger than 1013 M⊙. The red dashed line represents the relation from Popesso et al. (2005), the cyan dotted line shows the relation from Eckmiller et al. (2011), the magenta dash-dotted line corresponds to Schellenberger & Reiprich (2017), and the blue dashed line represents the relation from Kettula et al. (2015).
Current usage metrics show cumulative count of Article Views (full-text article views including HTML views, PDF and ePub downloads, according to the available data) and Abstracts Views on Vision4Press platform.
Data correspond to usage on the plateform after 2015. The current usage metrics is available 48-96 hours after online publication and is updated daily on week days.
Initial download of the metrics may take a while.