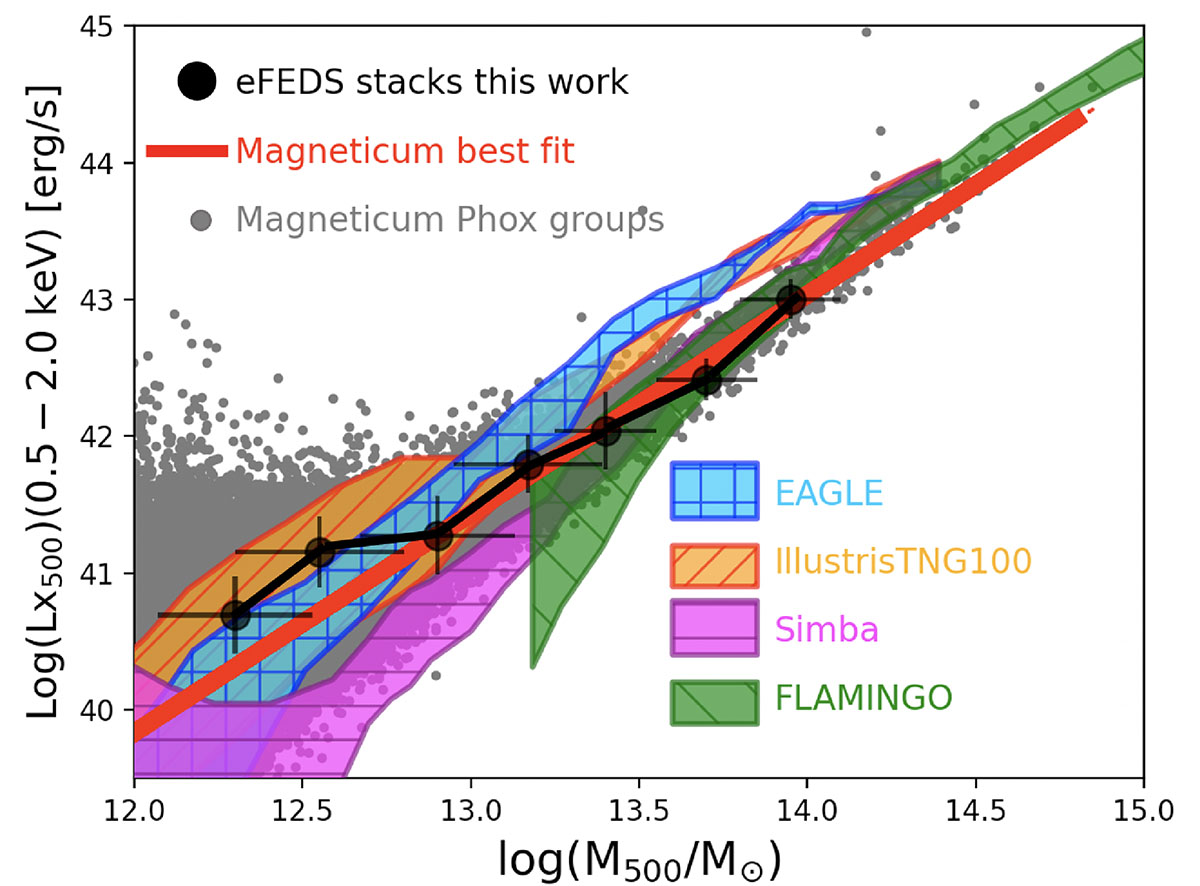
Fig. 7.
Download original image
Comparison of the LX, 500 − M500 relation presented here with predictions from various state-of-the-art hydrodynamical simulations. The black points represent the relation presented here and shown in the left panel of Fig. 6. The gray points correspond to halos from the Magneticum simulation, where the X-ray luminosity is computed in a manner consistent with the observations by summing the contribution of X-ray photons generated by Phox within r500 (see Marini et al. 2024, for details). The red solid line represents the best-fit relation derived from the Magneticum data points. Additionally, the cyan-shaded region reflects the predictions from the EAGLE simulation (Schaye et al. 2015), while the orange-shaded region shows the predictions from IllustrisTNG100 Pillepich et al. (2019). The magenta-shaded region corresponds to the predictions from SIMBA (Davé et al. 2019), and the green-shaded region illustrates the results from the FLAMINGO simulation (Braspenning et al. 2024).
Current usage metrics show cumulative count of Article Views (full-text article views including HTML views, PDF and ePub downloads, according to the available data) and Abstracts Views on Vision4Press platform.
Data correspond to usage on the plateform after 2015. The current usage metrics is available 48-96 hours after online publication and is updated daily on week days.
Initial download of the metrics may take a while.