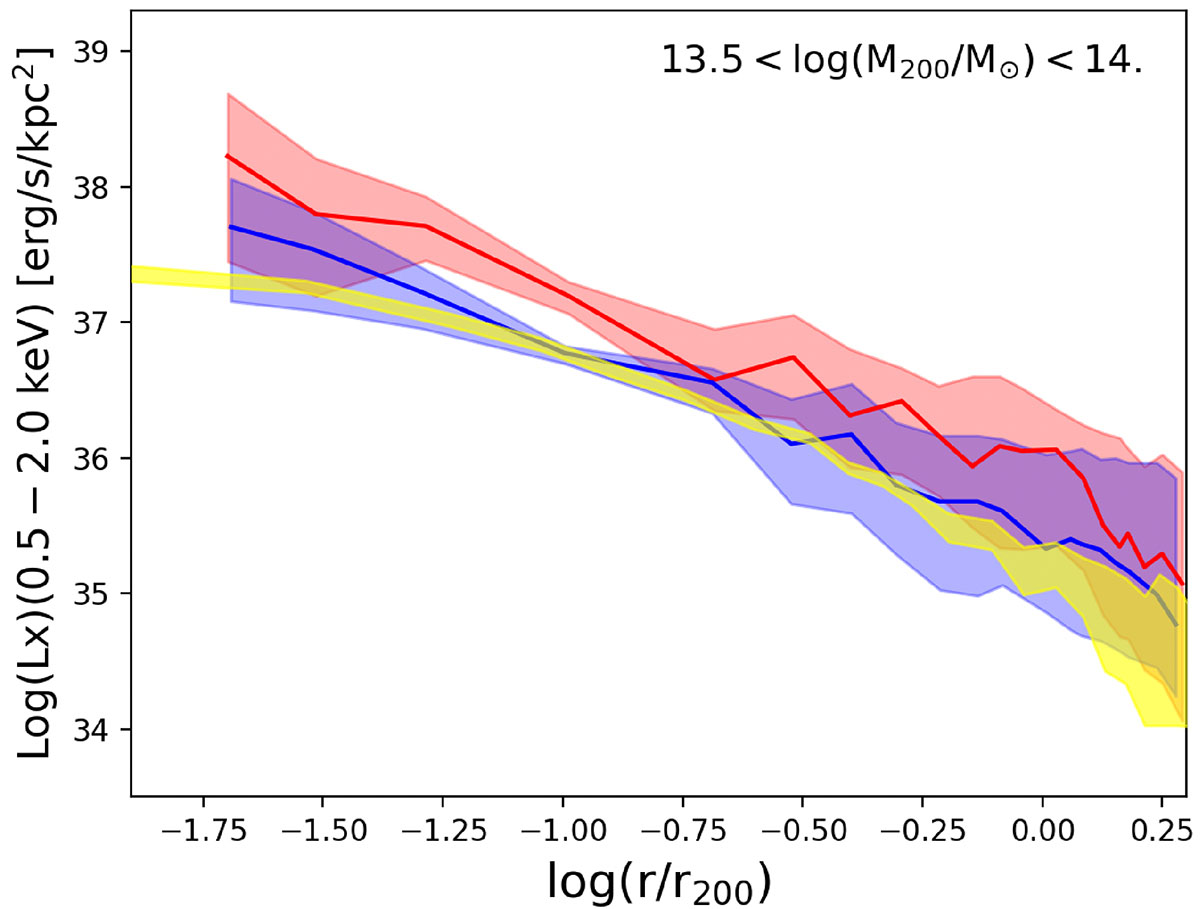
Fig. A.1.
Download original image
Comparison between X-ray surface brightness profiles obtained with different prior catalogs. The red solid line shows the average X-ray surface brightness profile obtained from the R11 catalog with the halo mass proxy and procedure used in this paper. The blue solid line indicates the average X-ray surface brightness profile obtained by stacking systems selected according to the halo mass proxy provided by Tinker et al. (2021) and stacked in the eFEDS data. In both profiles, the shaded region indicates the 1σ error. The yellow-shaded region shows the profiles obtained by stacking in eRASS:4 the groups selected according to the halo mass proxy of Tinker et al. (2021).
Current usage metrics show cumulative count of Article Views (full-text article views including HTML views, PDF and ePub downloads, according to the available data) and Abstracts Views on Vision4Press platform.
Data correspond to usage on the plateform after 2015. The current usage metrics is available 48-96 hours after online publication and is updated daily on week days.
Initial download of the metrics may take a while.