Fig. 1
Download original image
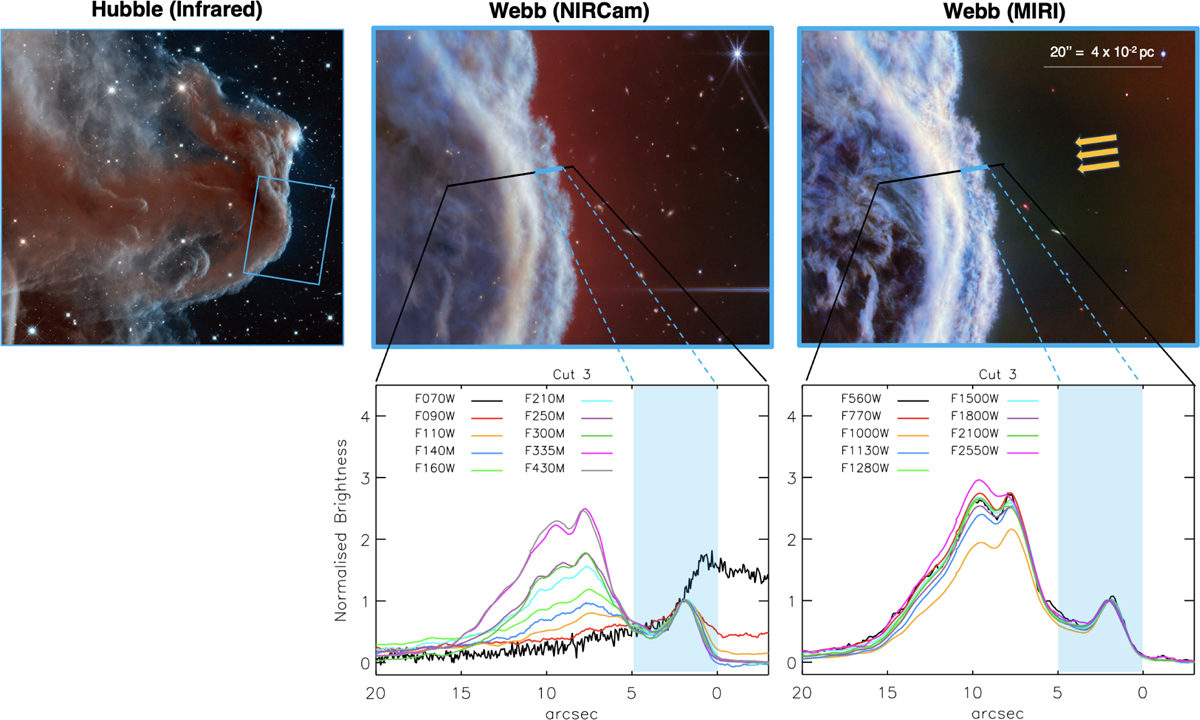
Top: (Left) Hubble’s view of the Horsehead nebula at near-infrared wavelengths of 1.1 μm (blue/cyan) and 1.6 μm (red/orange); NASA, ESA, and the Hubble Heritage Team (STScI/AURA). (Middle) a zoom-in image of part of the Horsehead nebula as seen by the NIRCam instrument. This image is composed of light at wavelengths of 1.4 and 2.5 μm (blue), 3.0 and 3.23 μm (cyan), 3.35 μm (green), 4.3 μm (yellow), and 4.7 and 4.05 μm (red). (Right) The same zoom-in region visualized by the JWST instrument MIRI. In this image, blue represents light at wavelengths of 5.6, 7.7, and 10 μm; green is 11, 12, and 15 μm; and red is 18, 21, and 25 μm. The NIRCam and MIRI images are from the recent ESA/Webb release, NASA, CSA, K. Misselt (University of Arizona) and A. Abergel (IAS/University Paris-Saclay, CNRS). The blue solid lines correspond to the cut used in our study. Bottom: profiles of the relative brightness (normalized at a distance of 2″ from the edge) for NIRCam and MIRI filters, adapted from Abergel et al. (2024).
Current usage metrics show cumulative count of Article Views (full-text article views including HTML views, PDF and ePub downloads, according to the available data) and Abstracts Views on Vision4Press platform.
Data correspond to usage on the plateform after 2015. The current usage metrics is available 48-96 hours after online publication and is updated daily on week days.
Initial download of the metrics may take a while.