Fig. 4
Download original image
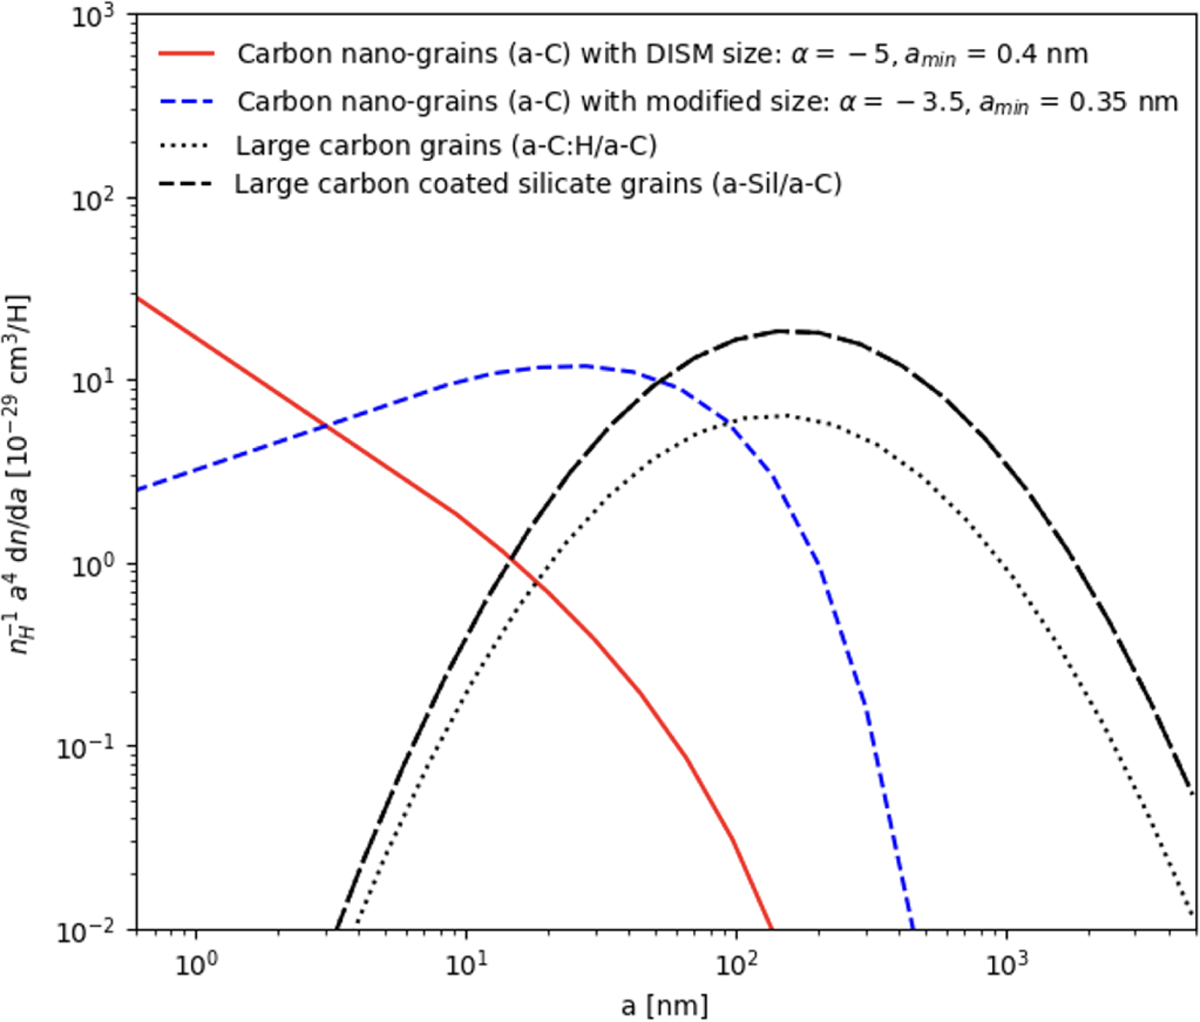
Size distributions of the dust mixtures from THEMIS using the dust emission tool DustEM (Compiègne et al. 2011) (parameters are listed in Table 2). The red, black dotted line, and black dashed line correspond to a-C, a-C:H/a-C and a-Sil/a-C respectively. The Blue dashed line corresponds to the distribution of a-C grains for the best-fit parameters at the edge of the Horsehead.
Current usage metrics show cumulative count of Article Views (full-text article views including HTML views, PDF and ePub downloads, according to the available data) and Abstracts Views on Vision4Press platform.
Data correspond to usage on the plateform after 2015. The current usage metrics is available 48-96 hours after online publication and is updated daily on week days.
Initial download of the metrics may take a while.