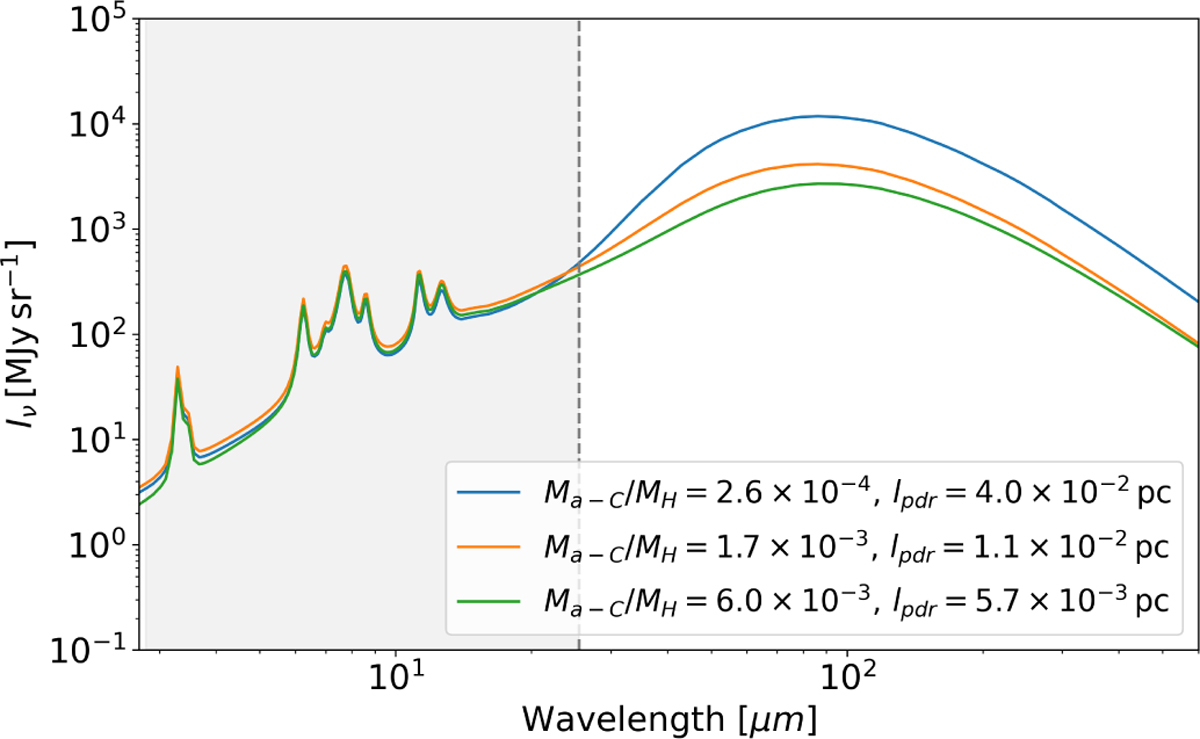
Fig. 8
Download original image
Spectra computed with SOC for different dust abundance values Ma-C/MH and Horsehead PDR layer thickness lPDR, highlighting the degeneracy between dust abundance and lPDR. The models shown correspond to a strongly depleted abundance (2.6 × 10⁻⁴, blue), a diffuse ISM-like abundance (1.7 × 10⁻³, green), and a high abundance (6.0 × 10⁻³, orange). An increase in Ma-C/MH is counterbalanced by a decrease in lPDR. The dashed vertical line marks the longest observed wavelength of 25.5 μm, which is thus most sensitive to the emission from large grains.
Current usage metrics show cumulative count of Article Views (full-text article views including HTML views, PDF and ePub downloads, according to the available data) and Abstracts Views on Vision4Press platform.
Data correspond to usage on the plateform after 2015. The current usage metrics is available 48-96 hours after online publication and is updated daily on week days.
Initial download of the metrics may take a while.