Fig. 9
Download original image
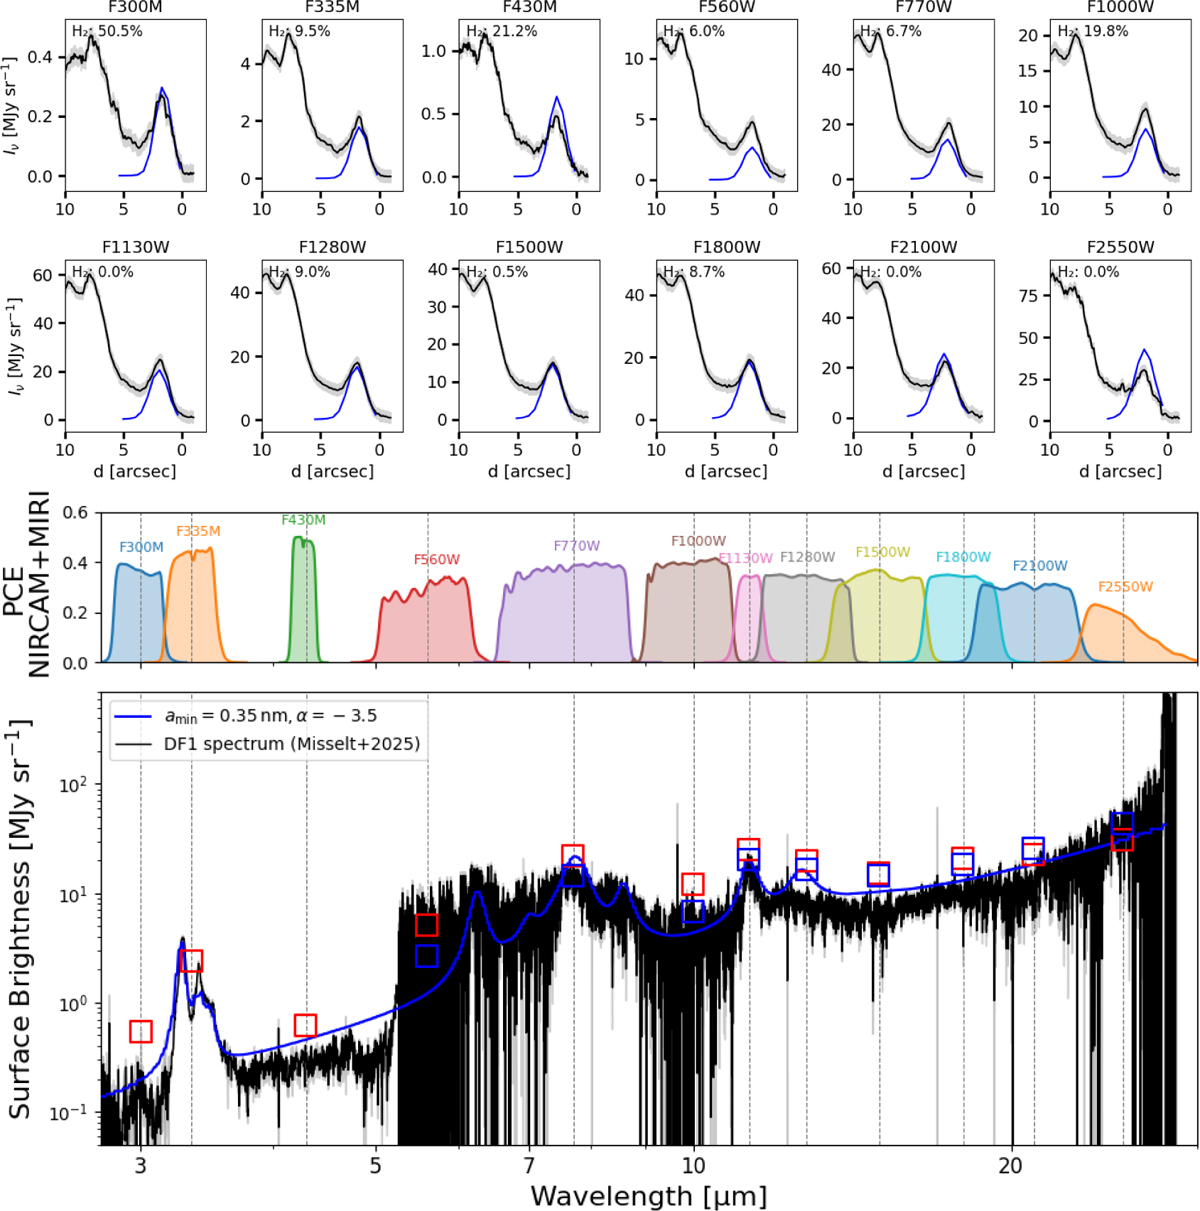
Comparison between JWST photometric and spectroscopic data and the self-coherent models using SOC and THEMIS. Top: comparison between the observed dust emission (black) and the modeled dust emission (blue) using the best set of dust parameters (from the model that minimized the ![]() showed in Fig. 7) in twelve photometric bands (3.0, 3.3 and 4.8 μm; NIRCam filters, and 7.7, 10.0, 11.3, 12.8, 15.0, 18.0, 21.0 and 25.5 μm; MIRI filters). The dust observed emission is shown in black lines. The errors are shown in light gray. The cut considered across the Horsehead is shown in blue in Fig. 1. Middle: wavelength coverage and photon-to-electron conversion efficiency (PCE) of the NIRCam and MIRI imager filters used in this study. The central wavelengths of the filters are indicated with dashed vertical lines. Bottom: comparison of the dust emission spectral energy distribution (SED) calculated using our radiative transfer model at the AIB peak emission with the NIRSpec+MRS spectrum for DF1 region of the Horsehead PDR (black). The full extracted spectrum was obtained by subtracting the fitted line contributions from the total flux as presented in Misselt et al. (2025). The photometric bands maximum values are represented by red squares and the photometric band points from the model are shown in blue squares.
showed in Fig. 7) in twelve photometric bands (3.0, 3.3 and 4.8 μm; NIRCam filters, and 7.7, 10.0, 11.3, 12.8, 15.0, 18.0, 21.0 and 25.5 μm; MIRI filters). The dust observed emission is shown in black lines. The errors are shown in light gray. The cut considered across the Horsehead is shown in blue in Fig. 1. Middle: wavelength coverage and photon-to-electron conversion efficiency (PCE) of the NIRCam and MIRI imager filters used in this study. The central wavelengths of the filters are indicated with dashed vertical lines. Bottom: comparison of the dust emission spectral energy distribution (SED) calculated using our radiative transfer model at the AIB peak emission with the NIRSpec+MRS spectrum for DF1 region of the Horsehead PDR (black). The full extracted spectrum was obtained by subtracting the fitted line contributions from the total flux as presented in Misselt et al. (2025). The photometric bands maximum values are represented by red squares and the photometric band points from the model are shown in blue squares.
Current usage metrics show cumulative count of Article Views (full-text article views including HTML views, PDF and ePub downloads, according to the available data) and Abstracts Views on Vision4Press platform.
Data correspond to usage on the plateform after 2015. The current usage metrics is available 48-96 hours after online publication and is updated daily on week days.
Initial download of the metrics may take a while.