Fig. 3
Download original image
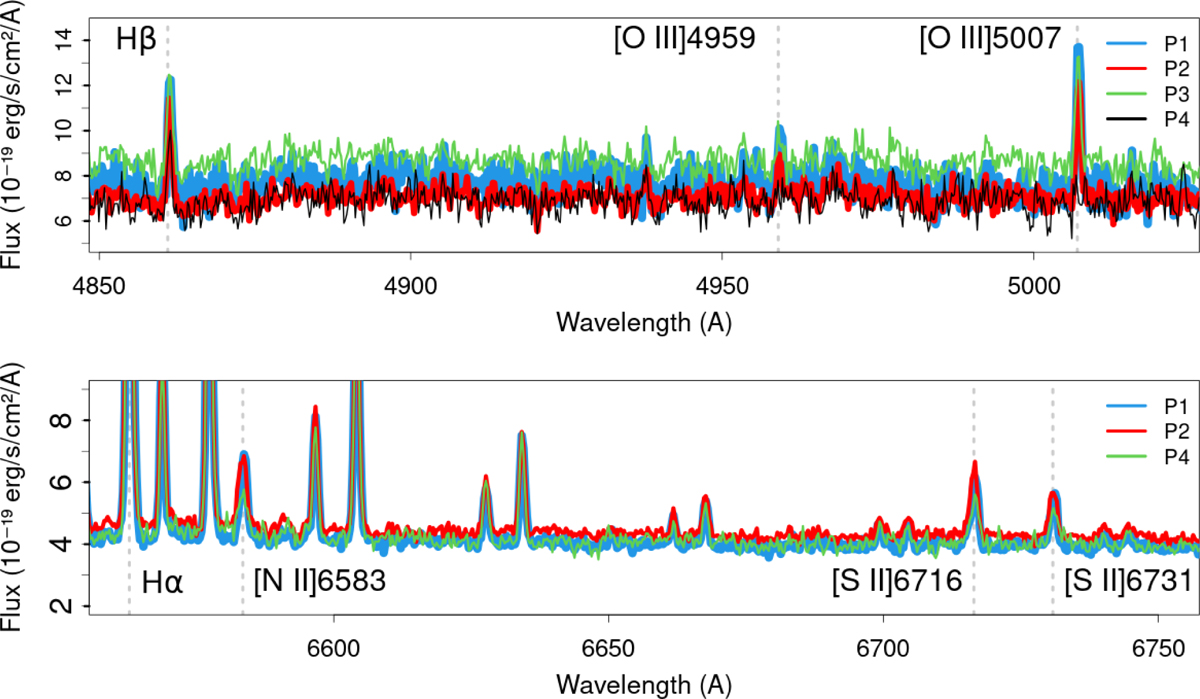
MEGARA spectra of the pointings in the first night (four in the blue range, three in the red), in the observed wavelength frame. Top. The LR-B spectra, centered in the wavelength range from Hβ to [O III] 5007. Bottom. The LR-R spectra, from [N II] 6583 to [S II]6731. The emission lines of interest are marked in both plots. The lines that are not marked are sky emission lines, with Hα being contaminated by one.
Current usage metrics show cumulative count of Article Views (full-text article views including HTML views, PDF and ePub downloads, according to the available data) and Abstracts Views on Vision4Press platform.
Data correspond to usage on the plateform after 2015. The current usage metrics is available 48-96 hours after online publication and is updated daily on week days.
Initial download of the metrics may take a while.