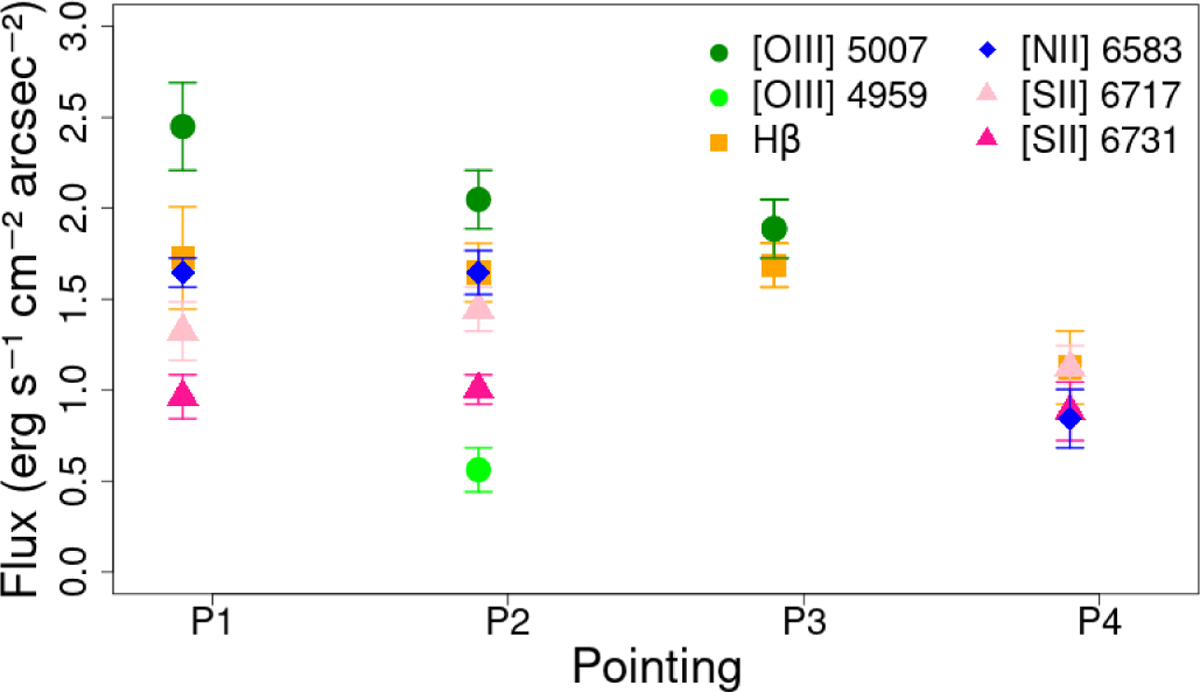
Fig. 4
Download original image
Line fluxes measured with MEGARA at GTC in the different pointings in the region of the nebula on the first night of observations. They correspond to the integrated flux of the best-fitting Gaussian function to the line profile. The lines that are missing have not been detected by our code in the spectra, except for the red lines (λ>6000 Å) in P3, where those observations were not made.
Current usage metrics show cumulative count of Article Views (full-text article views including HTML views, PDF and ePub downloads, according to the available data) and Abstracts Views on Vision4Press platform.
Data correspond to usage on the plateform after 2015. The current usage metrics is available 48-96 hours after online publication and is updated daily on week days.
Initial download of the metrics may take a while.