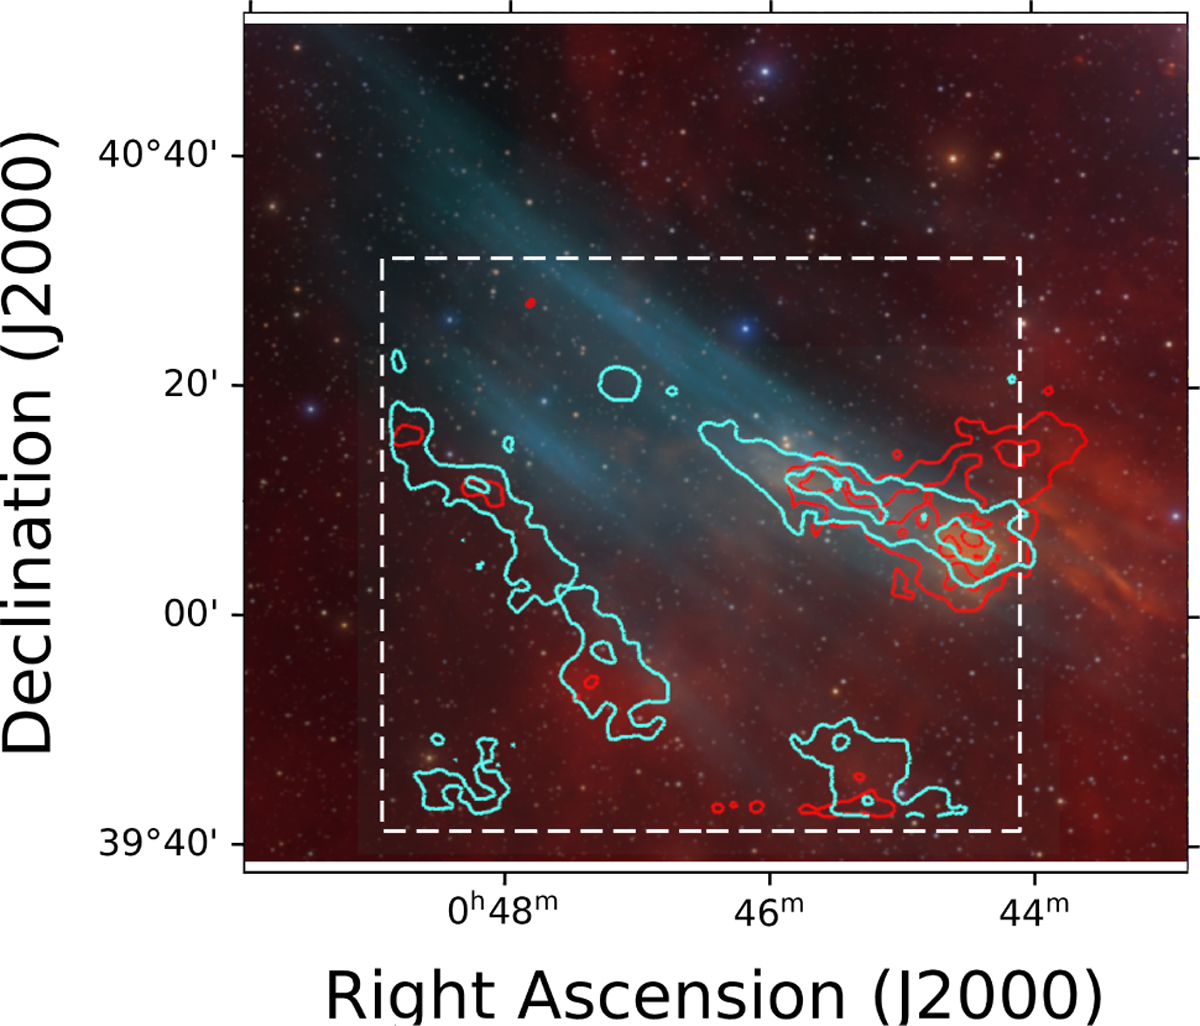
Fig. 6
Download original image
Contours of emission in the JAST80 observations on the nebula, for [O II] (filter J0378) in cyan and for Hα in red (filter J0660). The dashed-line square represents the region with full depth in the JAST80 images. In the background, the RGB composition shown in Fig. 1 and presented in Drechsler et al. (2023), with red tracing Hα and cyan [O III].
Current usage metrics show cumulative count of Article Views (full-text article views including HTML views, PDF and ePub downloads, according to the available data) and Abstracts Views on Vision4Press platform.
Data correspond to usage on the plateform after 2015. The current usage metrics is available 48-96 hours after online publication and is updated daily on week days.
Initial download of the metrics may take a while.