Fig. 1
Download original image
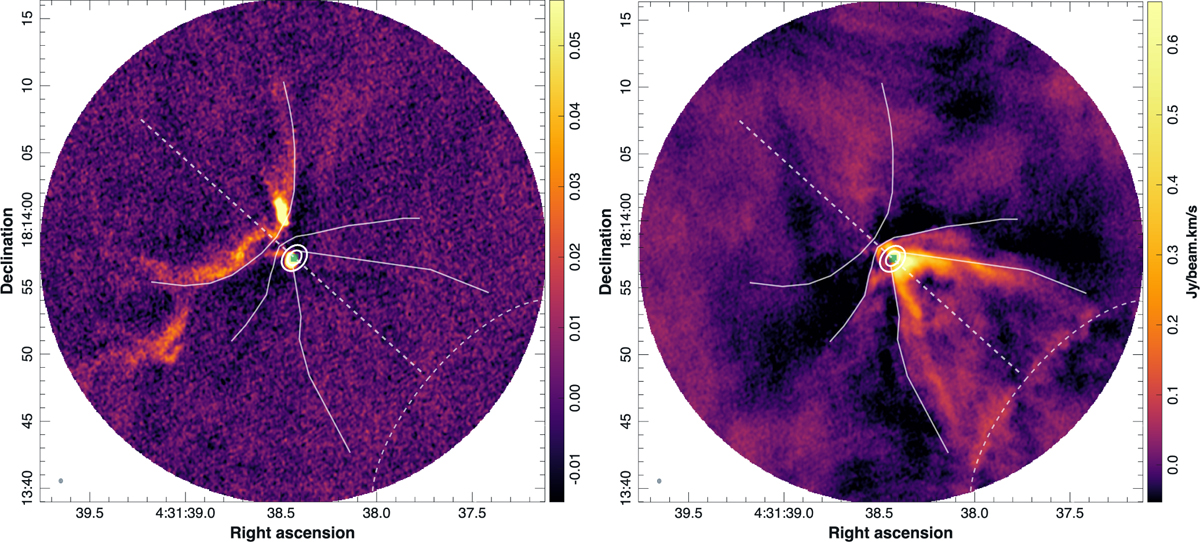
Left: moment 0 maps of the CO (2–1) emission integrated over the velocity interval VLSR = (−10, +3) km s−1, highlighting the morphology of the blueshifted outflow lobe. The red contours at the center of the panel corresponds to the disk continuum emission at 1.3 mm drawn at [10, 200]σc, with σc=1.2×10⁻⁴ Jy beam−1. The green square in the center of the contours marks the position of the continuum peak. The white dashed line at PA=48° indicates the orientation of the disk minor axis, and the white solid curves outline the spatial limits of the main wind components described in the text. Right: same as left panel, but with velocity integration range VLSR = (+8, +30) km s−1, illustrating the structure of the redshifted lobe. The beam is drawn in the bottom left corner. We note the difference in brightness between the two lobes: the blueshifted lobe is about ten times fainter.
Current usage metrics show cumulative count of Article Views (full-text article views including HTML views, PDF and ePub downloads, according to the available data) and Abstracts Views on Vision4Press platform.
Data correspond to usage on the plateform after 2015. The current usage metrics is available 48-96 hours after online publication and is updated daily on week days.
Initial download of the metrics may take a while.