Fig. B.2
Download original image
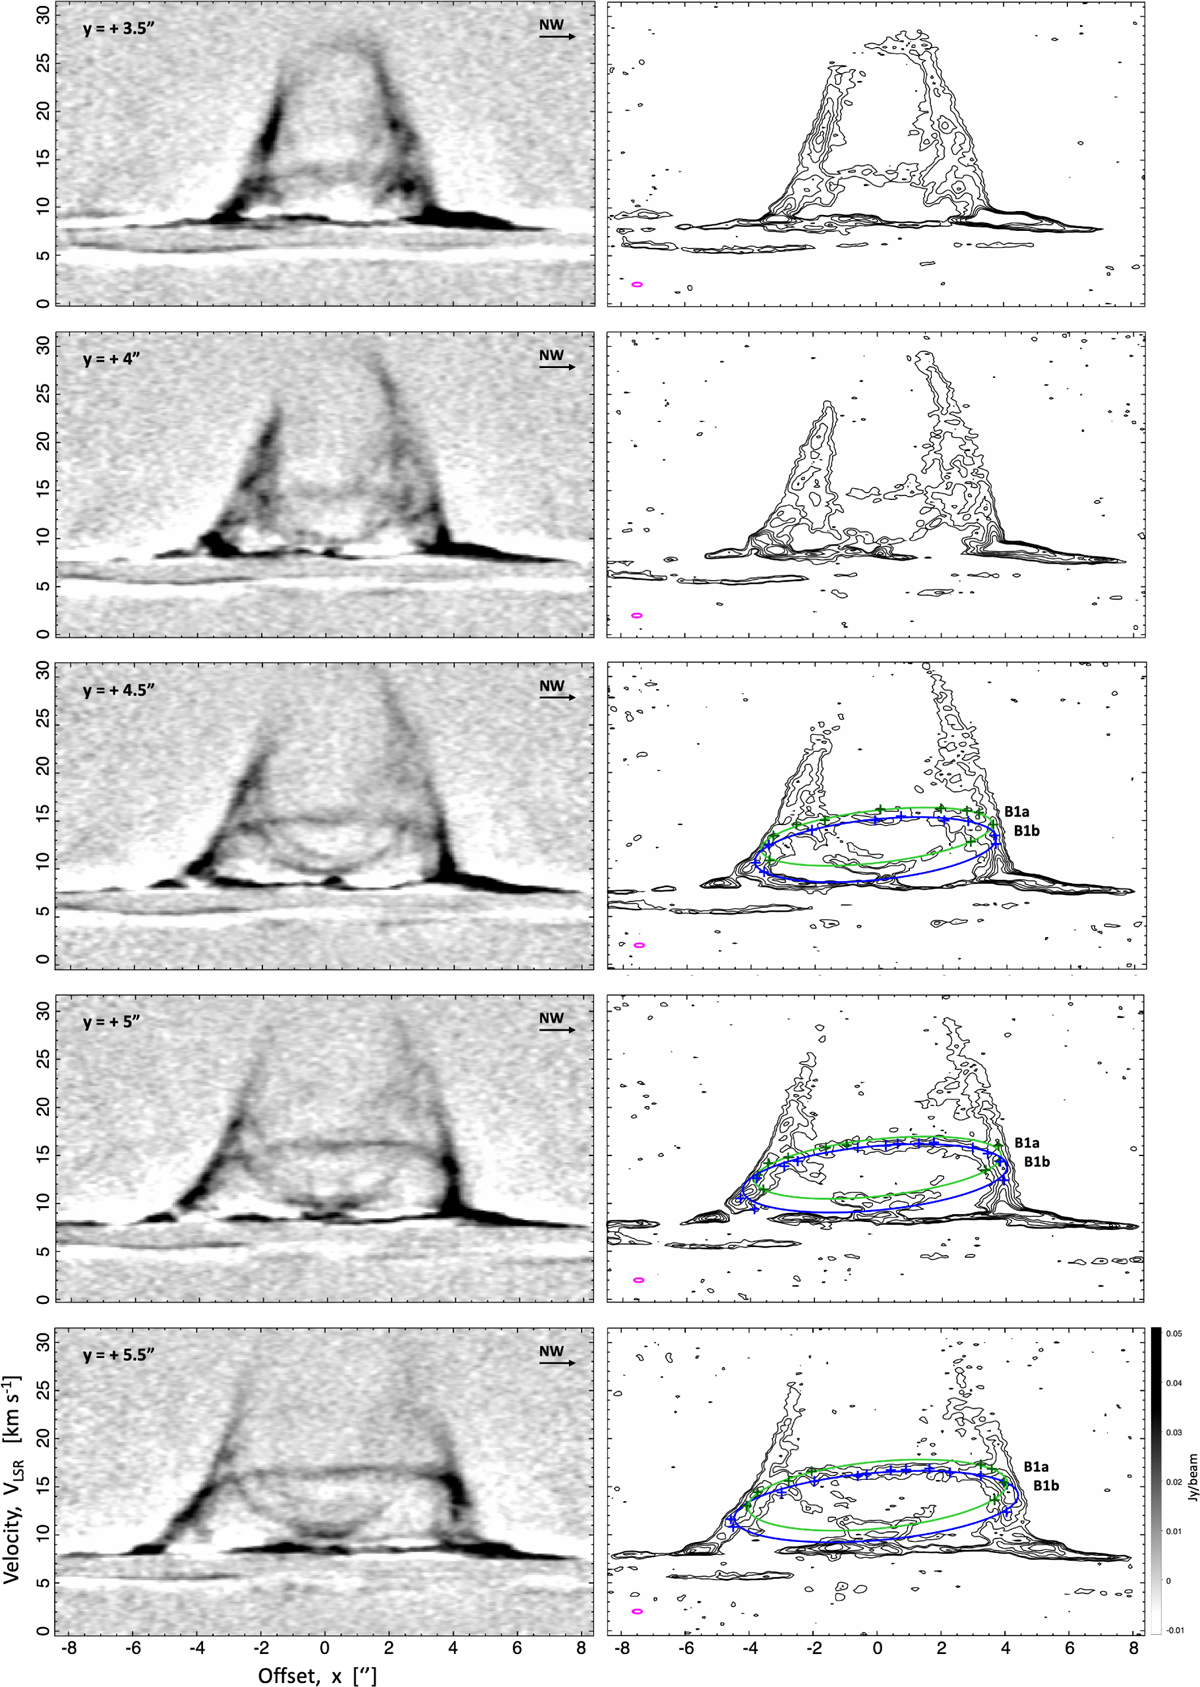
Left panels:Position-velocity diagrams taken across the redshifted outflow lobe (PV⊥ diagrams), with a ![]() wide virtual slit centered on the flow axis and perpendicular to it (PA = 318°), with positive x offsets toward NW. The separation of the virtual slit from the source in arcseconds is given in the upper left corner. Right panels: Ellipse fits to the features in the corresponding PV diagram, where an identification was possible. The contour levels are at 5, 10, 20, 30, 40, 50 mJy beam−1. The crosses indicate the sample points, all chosen above an emission threshold at the 3σPV level, with σPV = 2 mJy beam−1 (see text for details). Color code is green, blue, and red for features B1a, B1b, and B2, respectively. The small magenta ellipse at the bottom left corner indicates the uncertainty (
wide virtual slit centered on the flow axis and perpendicular to it (PA = 318°), with positive x offsets toward NW. The separation of the virtual slit from the source in arcseconds is given in the upper left corner. Right panels: Ellipse fits to the features in the corresponding PV diagram, where an identification was possible. The contour levels are at 5, 10, 20, 30, 40, 50 mJy beam−1. The crosses indicate the sample points, all chosen above an emission threshold at the 3σPV level, with σPV = 2 mJy beam−1 (see text for details). Color code is green, blue, and red for features B1a, B1b, and B2, respectively. The small magenta ellipse at the bottom left corner indicates the uncertainty (![]() ×0.2 km s−1).
×0.2 km s−1).
Current usage metrics show cumulative count of Article Views (full-text article views including HTML views, PDF and ePub downloads, according to the available data) and Abstracts Views on Vision4Press platform.
Data correspond to usage on the plateform after 2015. The current usage metrics is available 48-96 hours after online publication and is updated daily on week days.
Initial download of the metrics may take a while.