Fig. F.1
Download original image
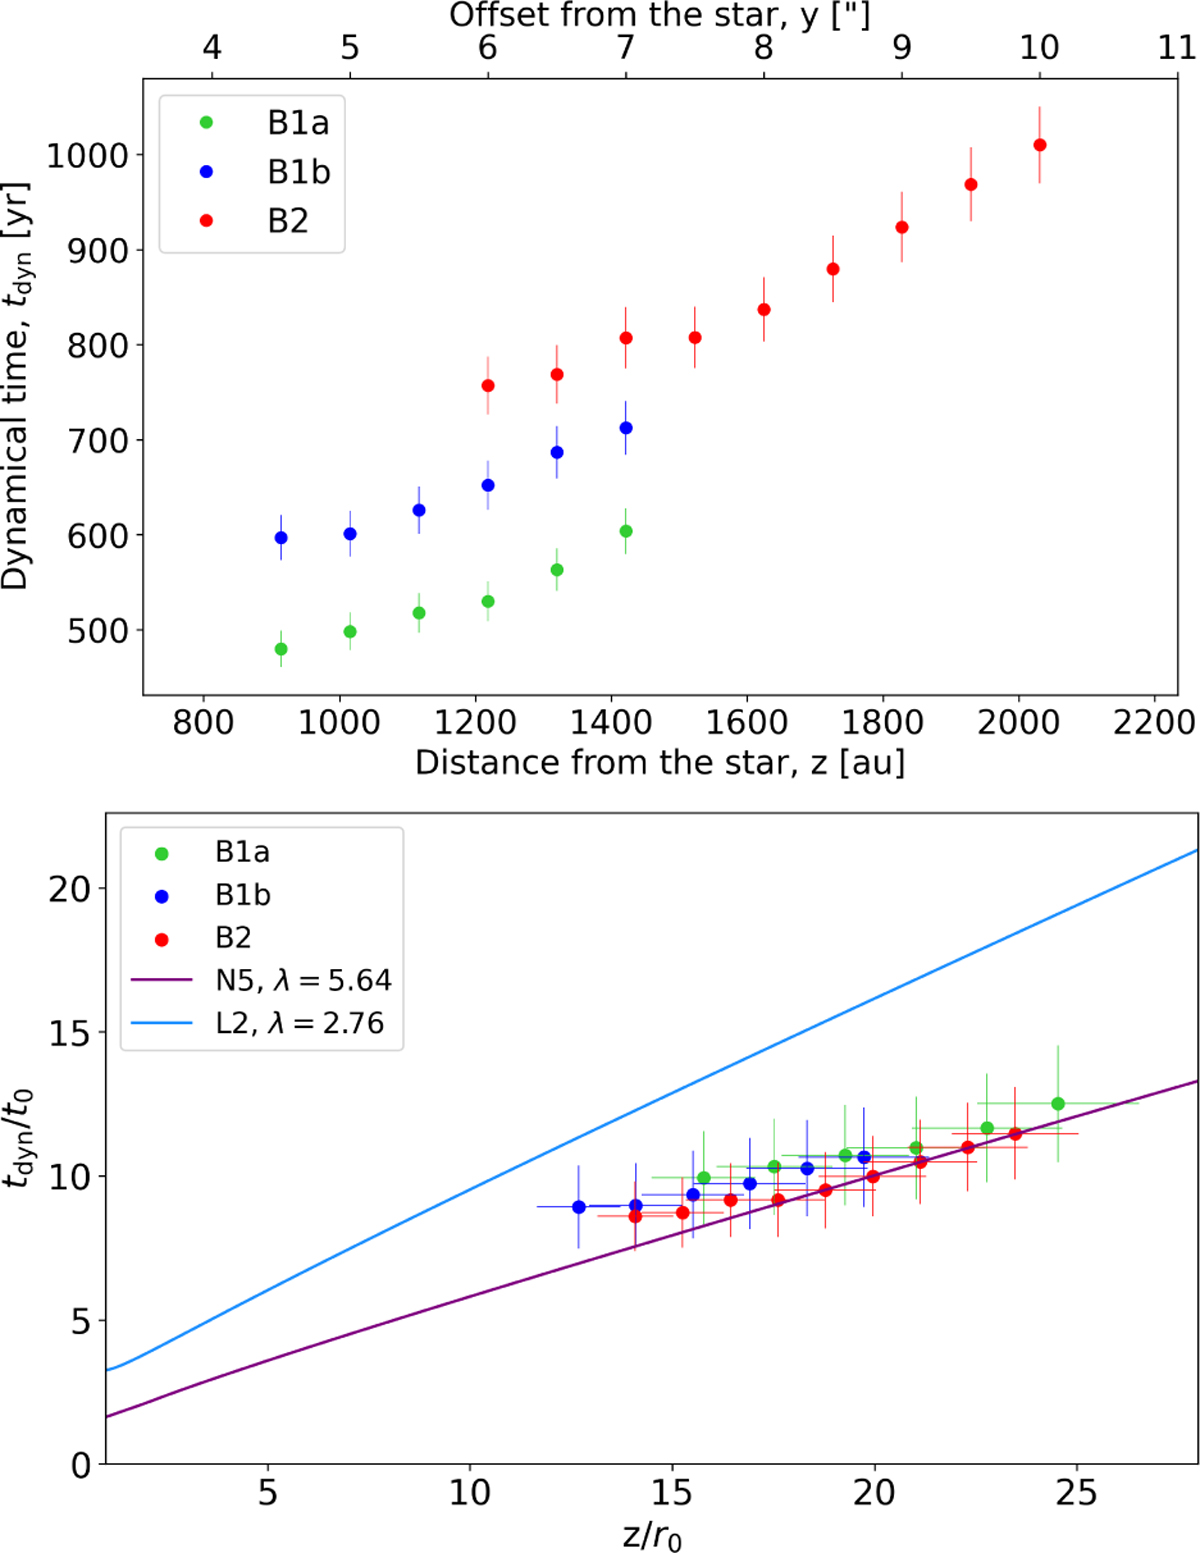
Top: Variation of the dynamical time tdyn = z/Vz with vertical distance from the source z of the flow substructures B1a, B1b, and B2 as derived from the tomographic analysis. Bottom: Comparison between the normalized dynamical time ![]() derived for each of the three shells and the analogous quantity estimated for the MHD disk wind models L2 (blue) and N5 (purple) illustrated in Section 5.4.
derived for each of the three shells and the analogous quantity estimated for the MHD disk wind models L2 (blue) and N5 (purple) illustrated in Section 5.4.
Current usage metrics show cumulative count of Article Views (full-text article views including HTML views, PDF and ePub downloads, according to the available data) and Abstracts Views on Vision4Press platform.
Data correspond to usage on the plateform after 2015. The current usage metrics is available 48-96 hours after online publication and is updated daily on week days.
Initial download of the metrics may take a while.