Fig. 4
Download original image
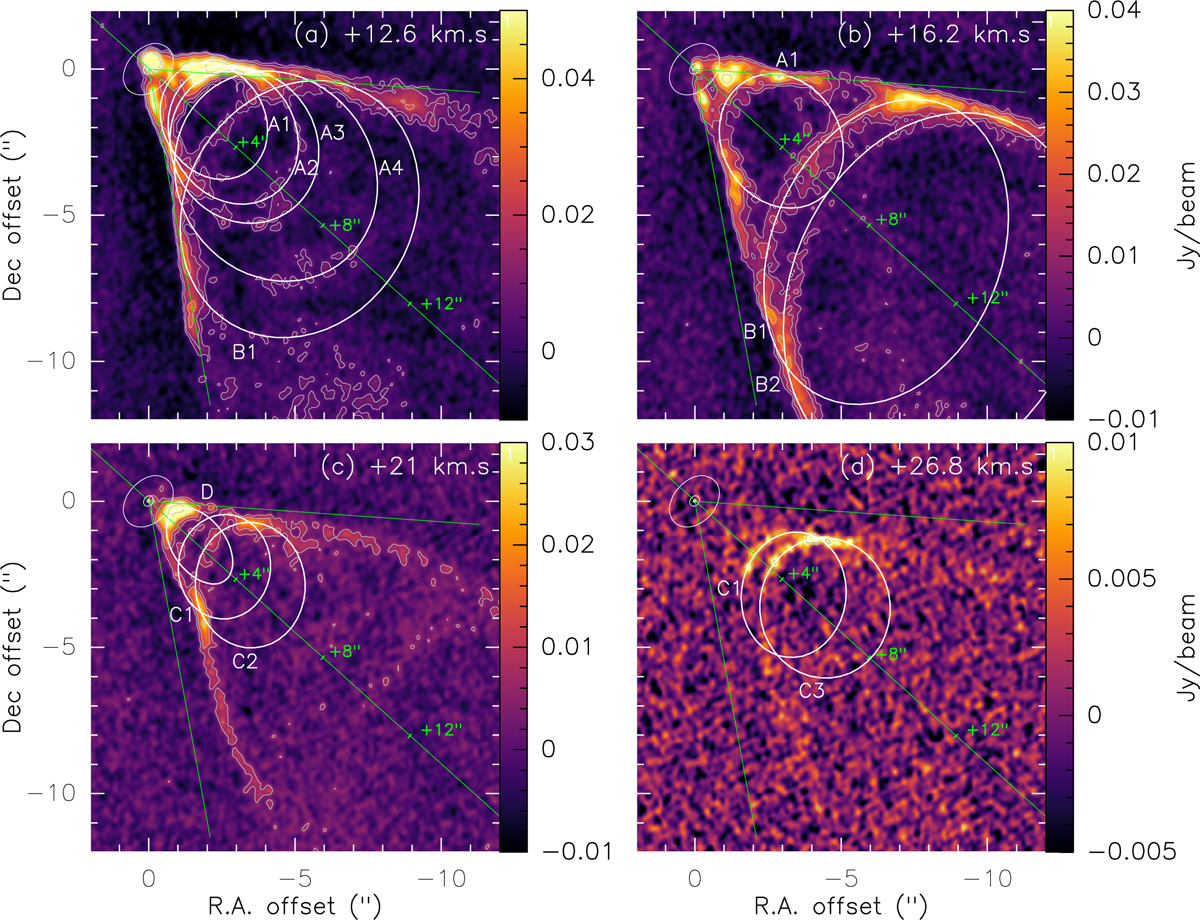
Zoomed-in images of channel maps at selected VLSR velocities, illustrating the system of arcs and bubble-like substructures visible in the redshifted outflow. The CO emission contours are drawn at [3, 6, 12, 24, 48]σCO. The two white contours of the 1.3 continuum at [30, 700]σc indicate the disk position. The green line oriented at PA=228° coincides with the direction of the disk minor axis, and defines the reference axis of the offset y from the source in the plane of the sky, with positive offsets toward SW. The other green lines mark the ±38° average opening angle of the apparent conical cavity at 12.6 km s−1, to illustrate the narrowing of the flow with increasing velocity. In the vicinity of the source, a number of arcs are seen to combine to form closed curves. Farther from the source only arcs opened toward the SW are visible. The superposed white ellipses are examples of visual fits to the identified features, labeled in families sharing common properties.
Current usage metrics show cumulative count of Article Views (full-text article views including HTML views, PDF and ePub downloads, according to the available data) and Abstracts Views on Vision4Press platform.
Data correspond to usage on the plateform after 2015. The current usage metrics is available 48-96 hours after online publication and is updated daily on week days.
Initial download of the metrics may take a while.