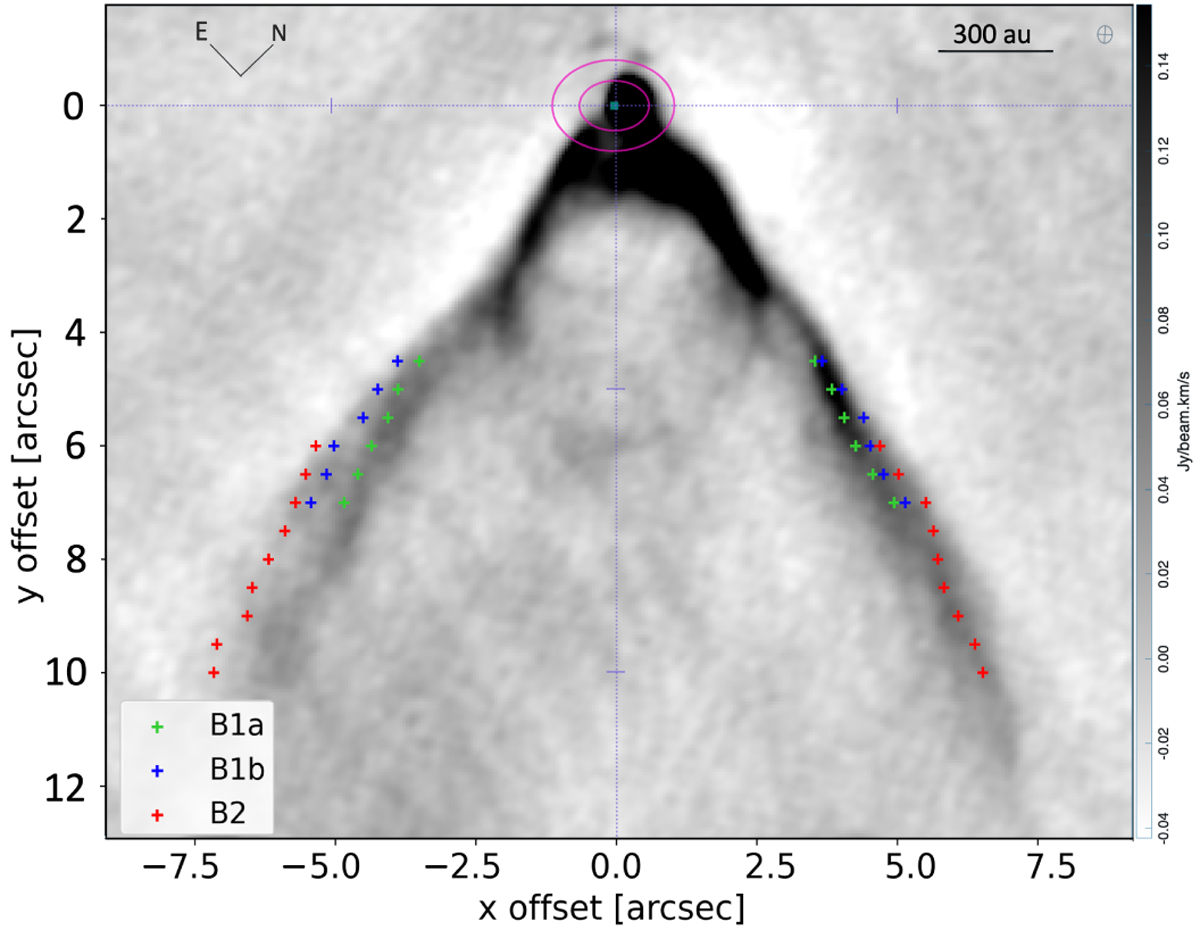
Fig. 9
Download original image
Position of the shells B1a, B1b, and B2 in the outflow, according to the tomographic analysis in Section 4.1. The coordinates of the SE and NW apexes of the ellipse fit as in Table 1 are superposed to an intensity (moment 0) map of the redshifted lobe integrated over the velocity range 10.6–16.2 km s−1 (characteristic of the considered traces), rotated clockwise by 48°to have the system axis along the vertical direction. The magenta ellipses are contours of the continuum emission at 10 and 200σc. The ellipse in the upper right corner is the beam size in CO maps.
Current usage metrics show cumulative count of Article Views (full-text article views including HTML views, PDF and ePub downloads, according to the available data) and Abstracts Views on Vision4Press platform.
Data correspond to usage on the plateform after 2015. The current usage metrics is available 48-96 hours after online publication and is updated daily on week days.
Initial download of the metrics may take a while.