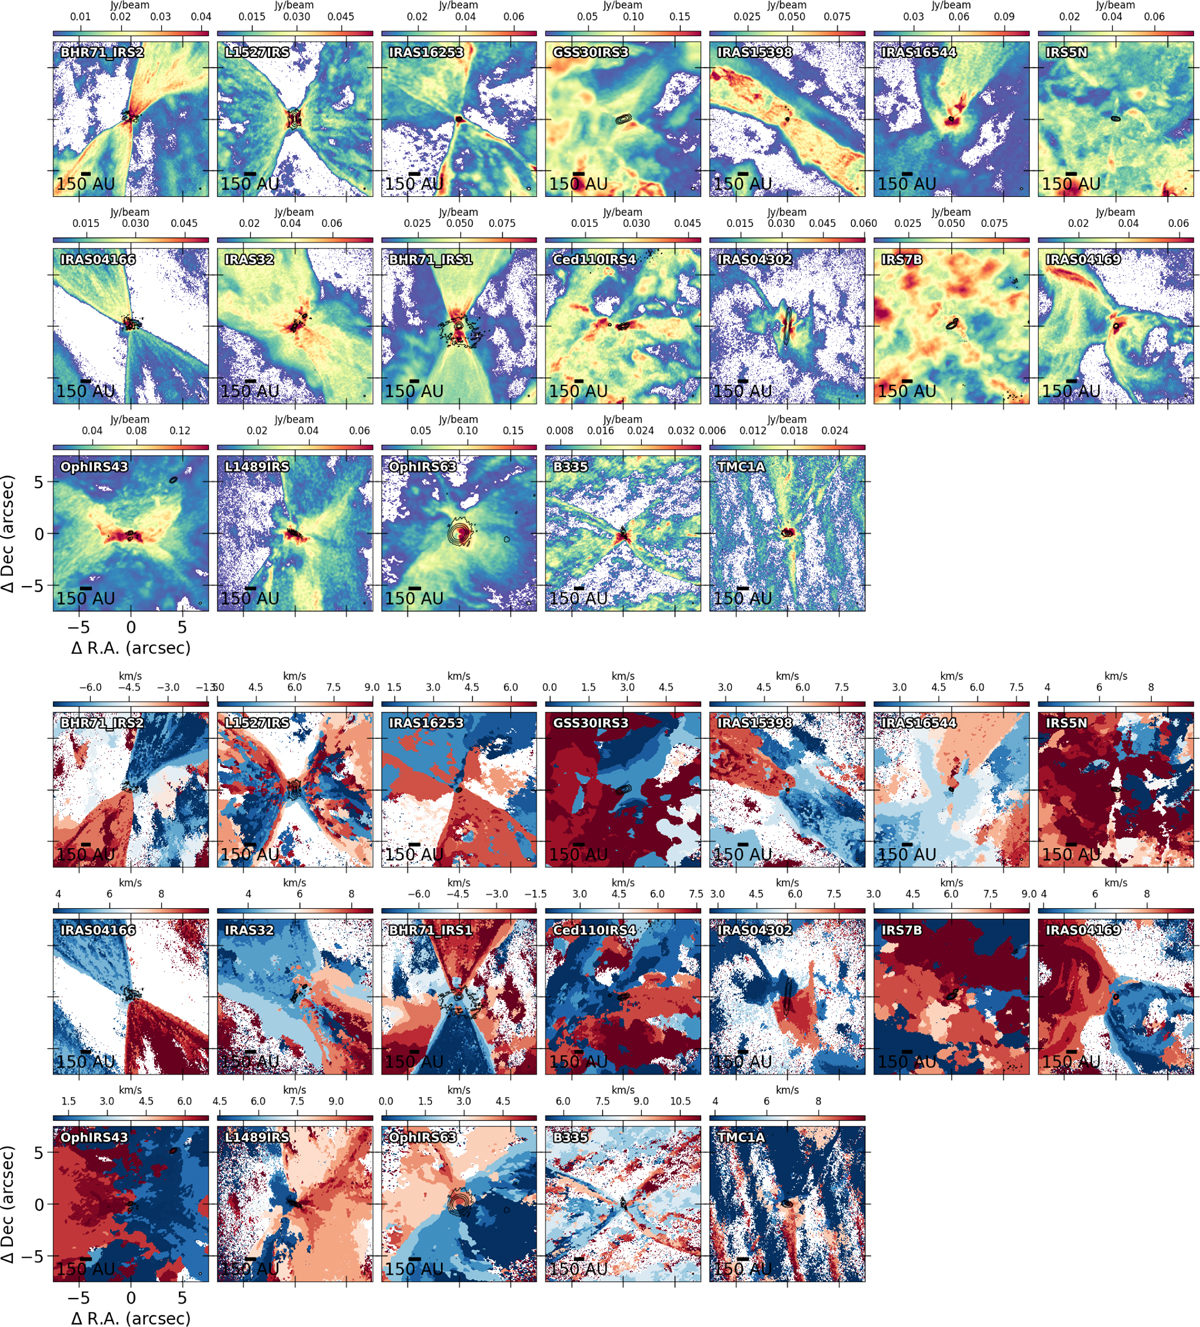
Fig. A.1
Download original image
Moment 8 (top) and moment 9 (bottom) maps depicting the 12CO (2–1) emission in the inner 15″ region of the nineteen eDisk sources. Moment maps were generated by integrating the regions where Iν > 3σ, where σ is the rms per channel. The sources are arranged in ascending order of Lbol except for B335 and TMC1A, the two sources taken from the archive. The contour lines display the continuum emission at thresholds of 5σ, 20σ, 80σ, and 320σ for each source. The scale bar located at the bottom left shows the 150 au scale in each source, and the synthesized beam is indicated in white at the bottom-right corner of each image.
Current usage metrics show cumulative count of Article Views (full-text article views including HTML views, PDF and ePub downloads, according to the available data) and Abstracts Views on Vision4Press platform.
Data correspond to usage on the plateform after 2015. The current usage metrics is available 48-96 hours after online publication and is updated daily on week days.
Initial download of the metrics may take a while.