Open Access
Fig. 7
Download original image
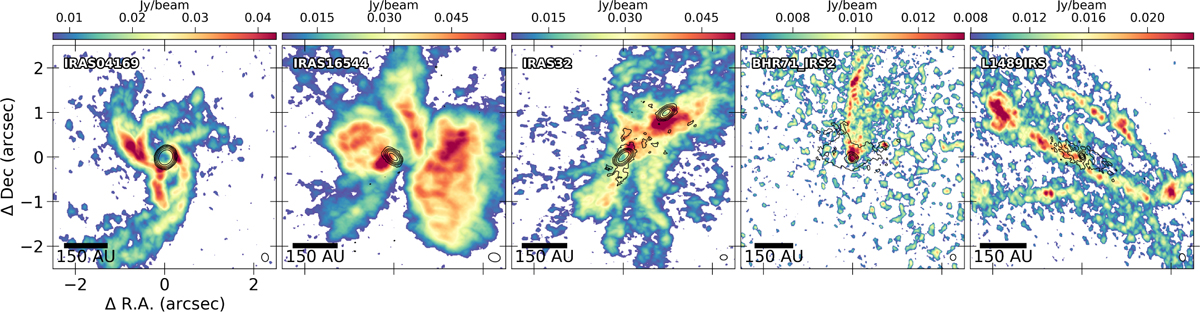
Moment 8 maps of SO (J=65−54) created using ≥3σ emissions toward five representative eDisk sources. The contours display the continuum emission at the same levels as Figure 3. The scale bar is located at the bottom left, and the synthesized beam is indicated in white at the bottom-right corner of each image.
Current usage metrics show cumulative count of Article Views (full-text article views including HTML views, PDF and ePub downloads, according to the available data) and Abstracts Views on Vision4Press platform.
Data correspond to usage on the plateform after 2015. The current usage metrics is available 48-96 hours after online publication and is updated daily on week days.
Initial download of the metrics may take a while.