Fig. 1.
Download original image
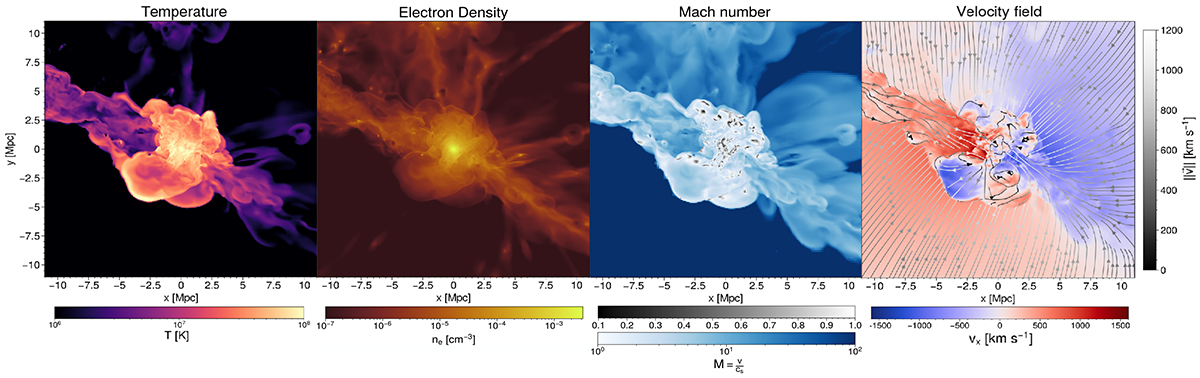
From left to right, we show longitudinal cuts of the temperature, electron density, Mach number, and velocity in the Virgo replica and the two filaments to which it is connected. The maps are about 22 Mpc wide, contain 157282 pixels, and are centred on the Virgo core. In the third panel, the Mach number and colour bands are used to display the wide range of values: The black-to-white colour band is on a linear scale in the [0.1,1] range, and the white-to-blue colour band is on a log scale in the [1100] range. In the right panel, the background map is the velocity along the x-axis of the simulation box, vx, and the foreground arrows represent the norm of the velocity field in the x − y plane, ||v||. The background (foreground) filament is in the left (right) part of each panel. The buoyant bubble is located roughly at a position (x = −5.0; y = 0.5) Mpc. Multiple galaxies are visible in the density map, for example, at positions ( − 2.5; −0.5) and ( − 6.0; 1.0) Mpc.
Current usage metrics show cumulative count of Article Views (full-text article views including HTML views, PDF and ePub downloads, according to the available data) and Abstracts Views on Vision4Press platform.
Data correspond to usage on the plateform after 2015. The current usage metrics is available 48-96 hours after online publication and is updated daily on week days.
Initial download of the metrics may take a while.