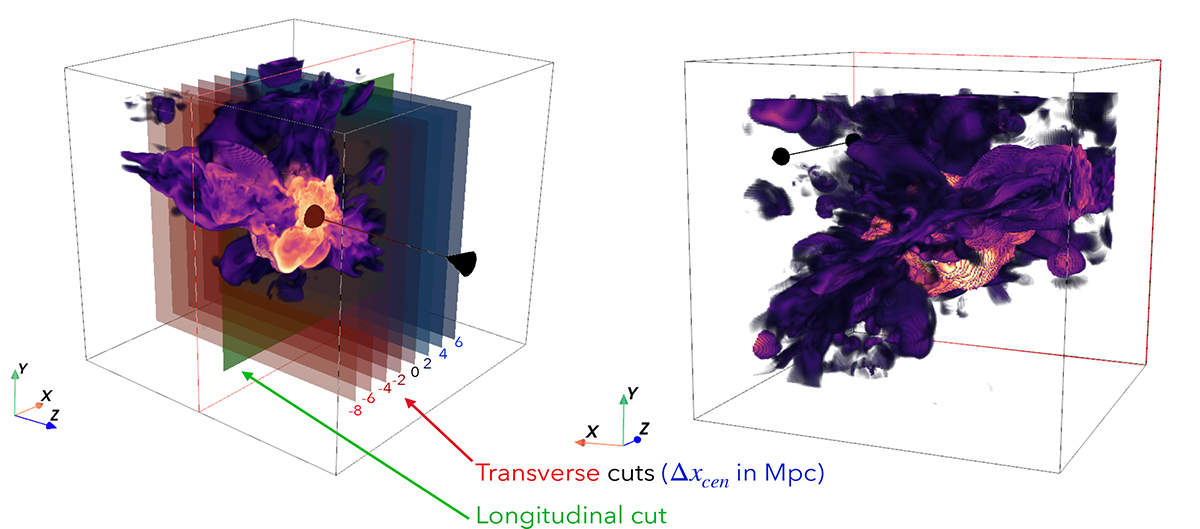
Fig. A.1.
Download original image
3D visualisation of the temperature in Virgo and its filaments. The green plane represents the longitudinal cut presented in Figs. 1,2 and 3, similarly to the slice shown in the left panel. The red to black to blue planes represent the transverse cuts presented in Figs. 4 and 5. In the right panel, the sheet of matter embedding the filaments is in the bottom-left to top-right diagonal. This clipping and slicing visualisation was made using the PyVista Python library (Sullivan & Kaszynski 2019). A video showing the simulation at different angles is available at this link: https://youtu.be/VZwacpKZNH4.
Current usage metrics show cumulative count of Article Views (full-text article views including HTML views, PDF and ePub downloads, according to the available data) and Abstracts Views on Vision4Press platform.
Data correspond to usage on the plateform after 2015. The current usage metrics is available 48-96 hours after online publication and is updated daily on week days.
Initial download of the metrics may take a while.