Fig. C.1.
Download original image
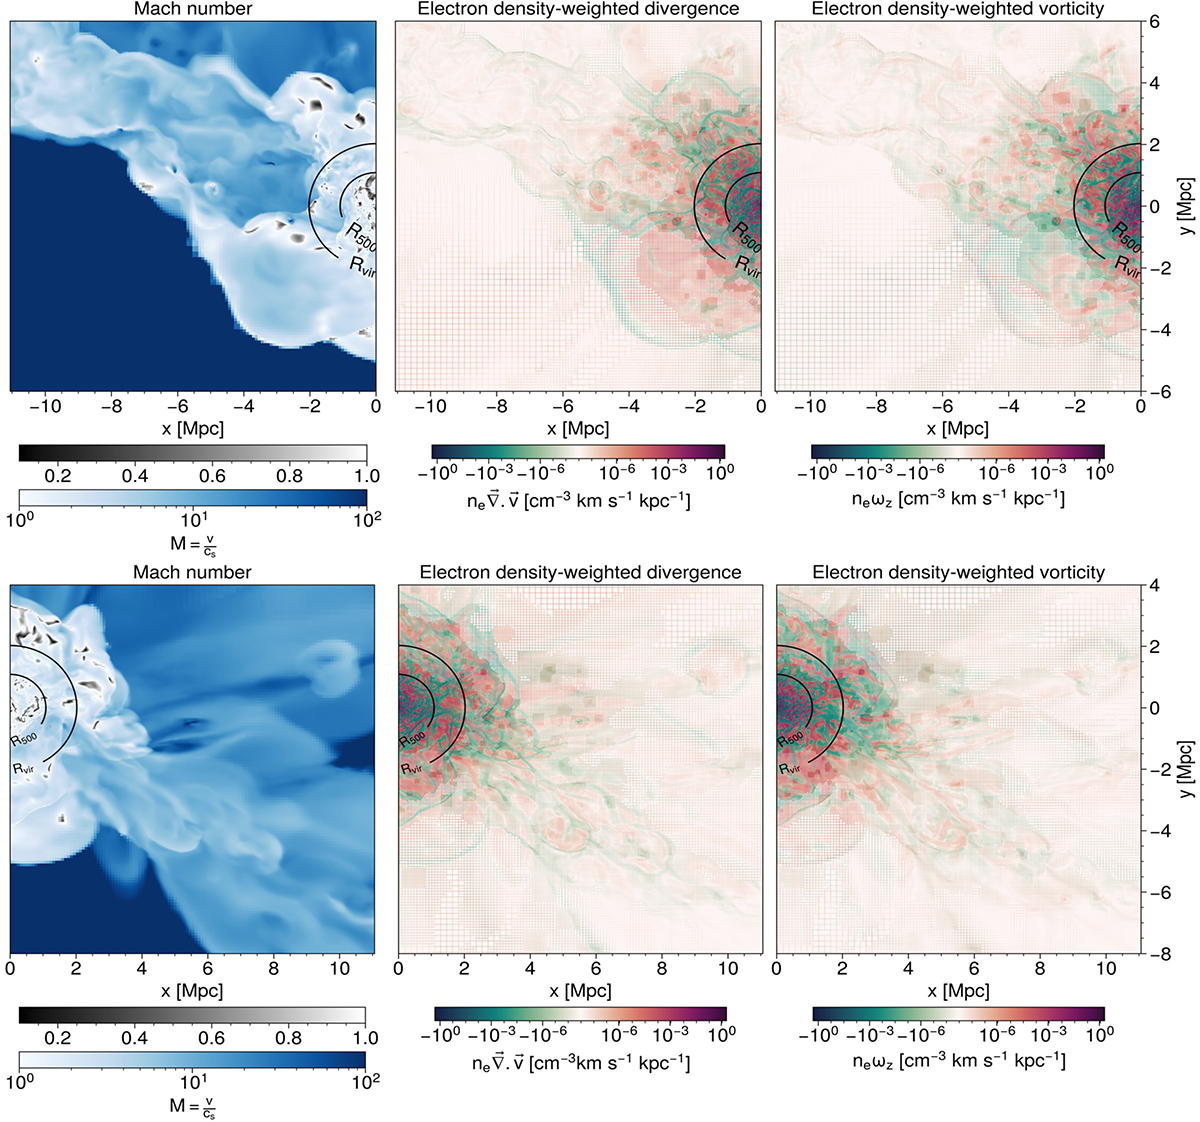
Zoom into the background (top) and foreground (bottom) filaments in the longitudinal cut. The maps are 11.061 × 12 Mpc large with the same resolution as those presented in Fig. 1. The left panel shows the Mach number, the central panel shows the electron density-weighted divergence, and the right panel shows the z component of the electron density-weighted vorticity. The Virgo R500 and virial radius, Rvir, are shown as black circle arcs on each map.
Current usage metrics show cumulative count of Article Views (full-text article views including HTML views, PDF and ePub downloads, according to the available data) and Abstracts Views on Vision4Press platform.
Data correspond to usage on the plateform after 2015. The current usage metrics is available 48-96 hours after online publication and is updated daily on week days.
Initial download of the metrics may take a while.