Open Access
Fig. E.1.
Download original image
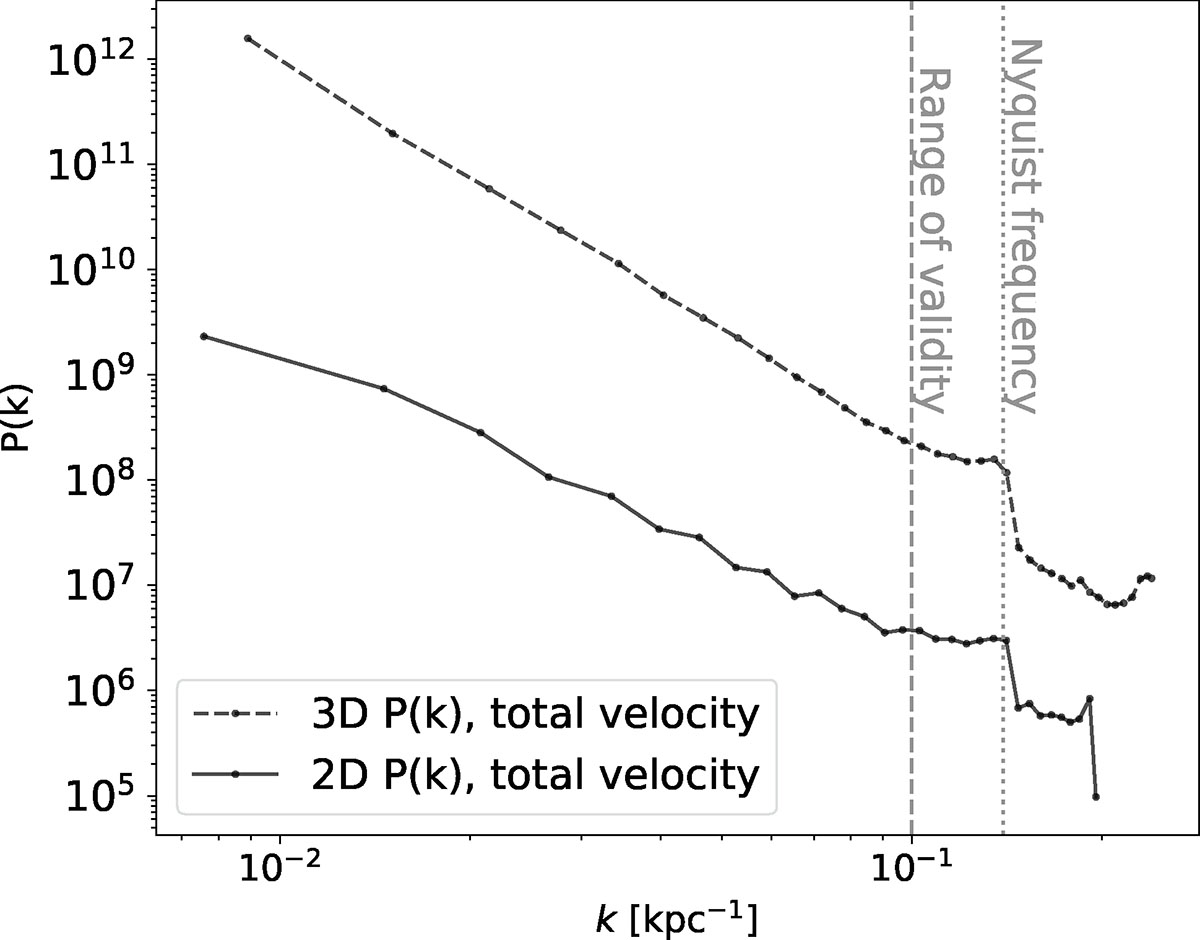
Full scale range of the 3D and 2D power spectra computed in the 5 Mpc cubed size box (squared size map) centred on the core of Virgo, similarly to Fig. 10. The chosen range of validity and the Nyquist frequency are shown by vertical dashed lines.
Current usage metrics show cumulative count of Article Views (full-text article views including HTML views, PDF and ePub downloads, according to the available data) and Abstracts Views on Vision4Press platform.
Data correspond to usage on the plateform after 2015. The current usage metrics is available 48-96 hours after online publication and is updated daily on week days.
Initial download of the metrics may take a while.