Fig. 5.
Download original image
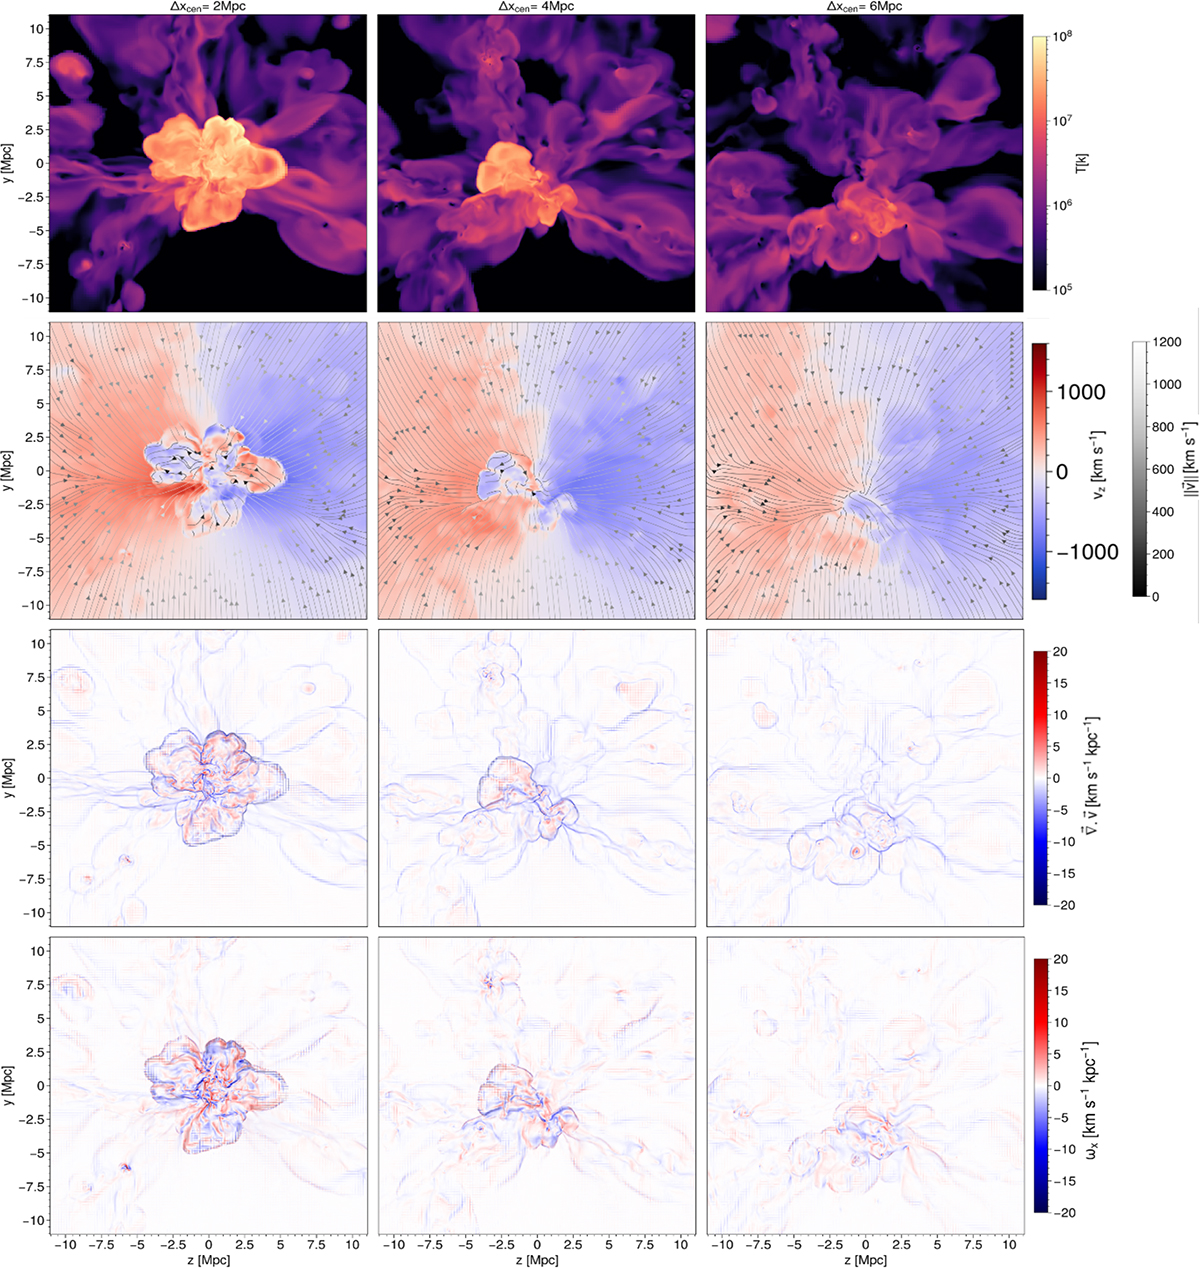
Transverse cuts along the foreground filament. From left to right, we present cuts at distances of 2, 4 and 6 Mpc from the Virgo centre. From top to bottom, we present the temperature, the velocity field with the background map being the velocity along the z simulation box axis, vz, and the foreground arrows representing the norm of the velocity field in the zy plane, ||v||, the divergence of the velocity field and the x component of its vorticity. Similarly to longitudinal cuts, the maps are 22.122 Mpc wide, contain 157282 pixels, and are centred on the Virgo centre.
Current usage metrics show cumulative count of Article Views (full-text article views including HTML views, PDF and ePub downloads, according to the available data) and Abstracts Views on Vision4Press platform.
Data correspond to usage on the plateform after 2015. The current usage metrics is available 48-96 hours after online publication and is updated daily on week days.
Initial download of the metrics may take a while.