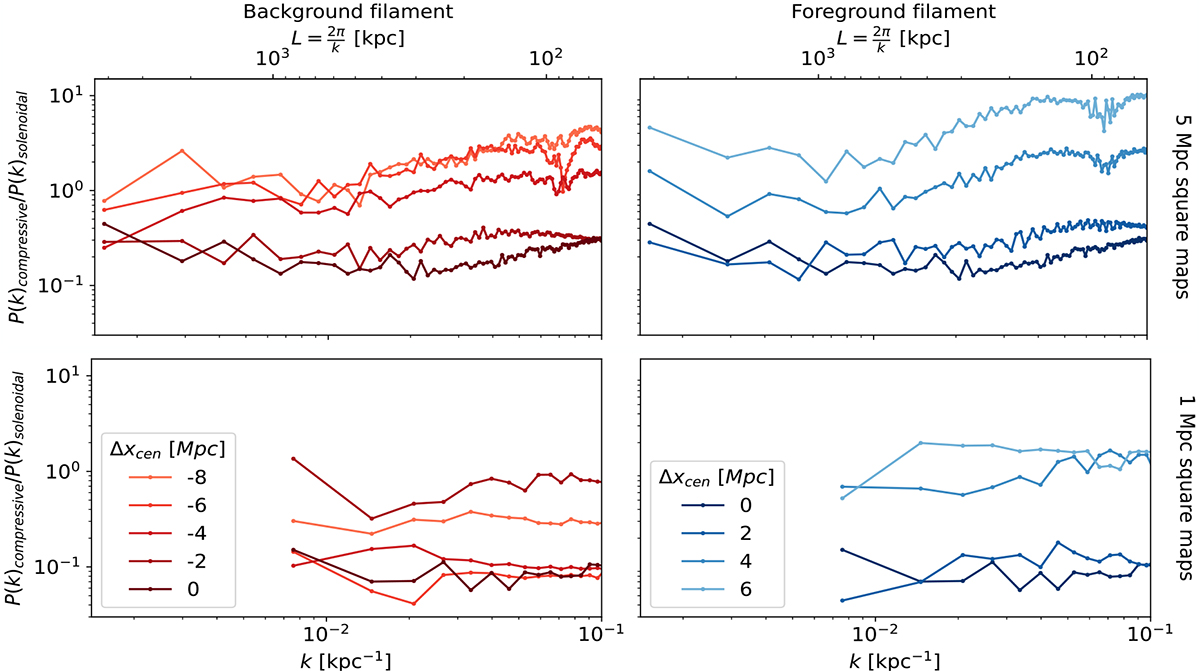
Fig. 9.
Download original image
Ratio of the power spectrum of the compressive over the solenoidal component of the velocity field. The top and bottom rows present ratios of spectra computed from, respectively, 5 and 1 Mpc square maps. The left column presents the ratios in slices in the background filament, that is, from red to black at Δxcen = { − 8, −6, −4, −2} Mpc, and in the Virgo core for comparison. The right column presents the ratios in slices in the foreground filament, from black to blue at Δxcen = {2, 4, 6} Mpc, and the Virgo core for comparison.
Current usage metrics show cumulative count of Article Views (full-text article views including HTML views, PDF and ePub downloads, according to the available data) and Abstracts Views on Vision4Press platform.
Data correspond to usage on the plateform after 2015. The current usage metrics is available 48-96 hours after online publication and is updated daily on week days.
Initial download of the metrics may take a while.