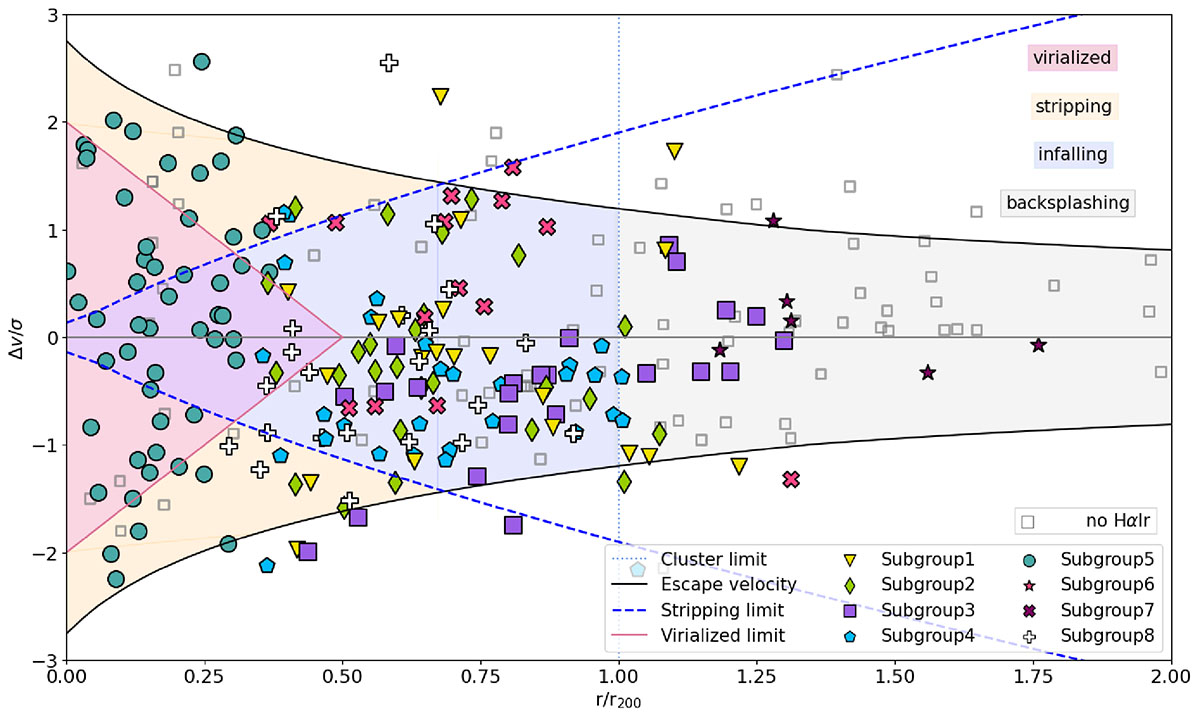
Fig. 10.
Download original image
PPSD showing the distribution of galaxies that were associated with potential substructures in Fig. 8. Different markers are associated with different subgroups. Empty markers are Hydra members outside of the HαIR sample. Positive values in the y axis correspond to redshifted galaxies, and negative values to blueshifted galaxies, as explained in Fig. 9.
Current usage metrics show cumulative count of Article Views (full-text article views including HTML views, PDF and ePub downloads, according to the available data) and Abstracts Views on Vision4Press platform.
Data correspond to usage on the plateform after 2015. The current usage metrics is available 48-96 hours after online publication and is updated daily on week days.
Initial download of the metrics may take a while.