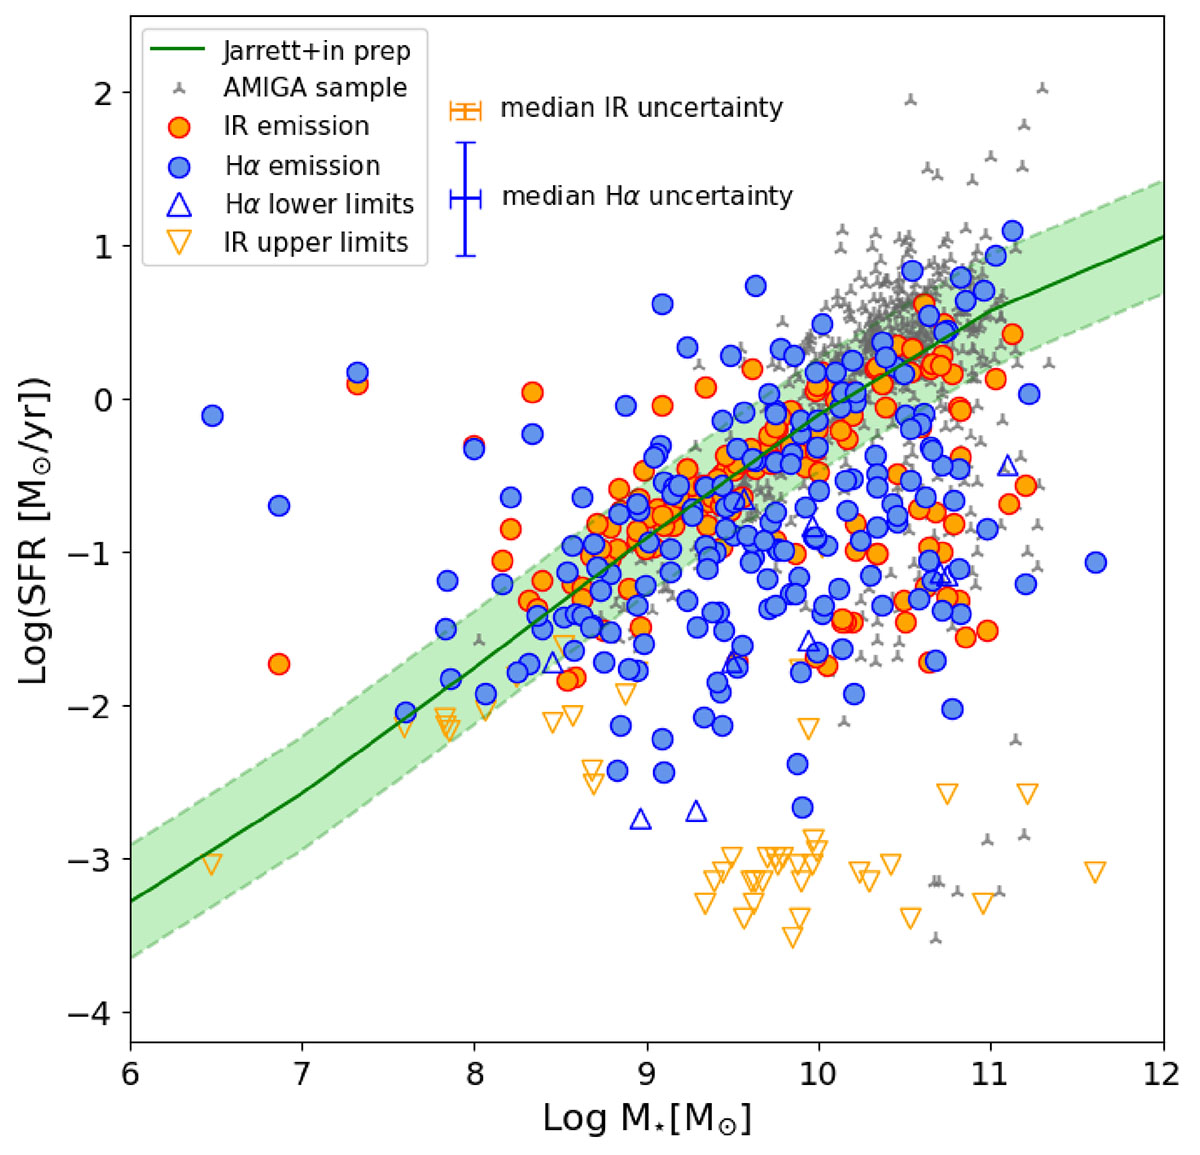
Fig. 4.
Download original image
Star formation rate versus stellar mass of the HαIR sample in a logarithmic scale, estimated from the mIR (orange) and Hα (blue) emission, respectively. The optical and infrared SFR of galaxies with low confidence measurements are plotted as empty triangles. The green region is what we have defined as the main mequence (MS) of star-forming galaxies. We used Jarrett+ in prep. fit of the MS and the σ that Bok et al. (2020) employed to define their MS from WISE mIR observations of AMIGA galaxies. For reference, AMIGA isolated galaxies from (Verley et al. 2007) are also shown in the background (gray). Average uncertainties for detections in Hα and mIR have been provided at the top of the diagram for clarity.
Current usage metrics show cumulative count of Article Views (full-text article views including HTML views, PDF and ePub downloads, according to the available data) and Abstracts Views on Vision4Press platform.
Data correspond to usage on the plateform after 2015. The current usage metrics is available 48-96 hours after online publication and is updated daily on week days.
Initial download of the metrics may take a while.