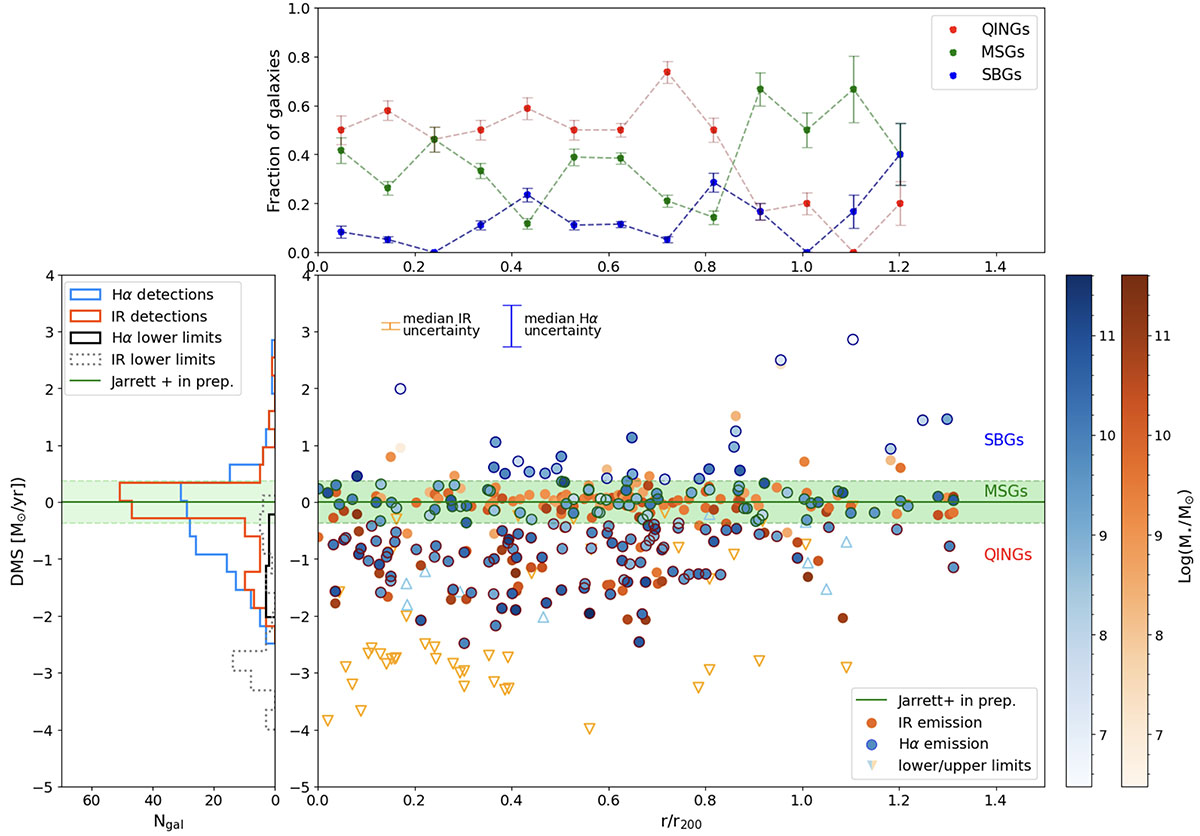
Fig. 5.
Download original image
Distance to the main sequence (DMS, eq. 1), or vertical distance between each SFRHα (blue) and SFRIR (orange) marker, and the MS, against clustercentric projected distance. Empty triangles show the population of galaxies with lower (upper) limits in their SFRHα (SFRIR) estimations. Galaxies are color-coded as a function of stellar mass. Galaxies are outlined in different colors in terms of their population: SBGs (blue), MSGs (green), and QINGs (red). Left: Histogram of the DMS for the Hα and mIR detections (blue and orange, respectively), and the Hα and mIR lower (black) and upper (gray) limits. Top: Fraction of QINGs (red), MSGs (green), and SBGs (blue) in distance bins of 0.96r/r200 out to 1.25r/r200.
Current usage metrics show cumulative count of Article Views (full-text article views including HTML views, PDF and ePub downloads, according to the available data) and Abstracts Views on Vision4Press platform.
Data correspond to usage on the plateform after 2015. The current usage metrics is available 48-96 hours after online publication and is updated daily on week days.
Initial download of the metrics may take a while.