Fig. 6.
Download original image
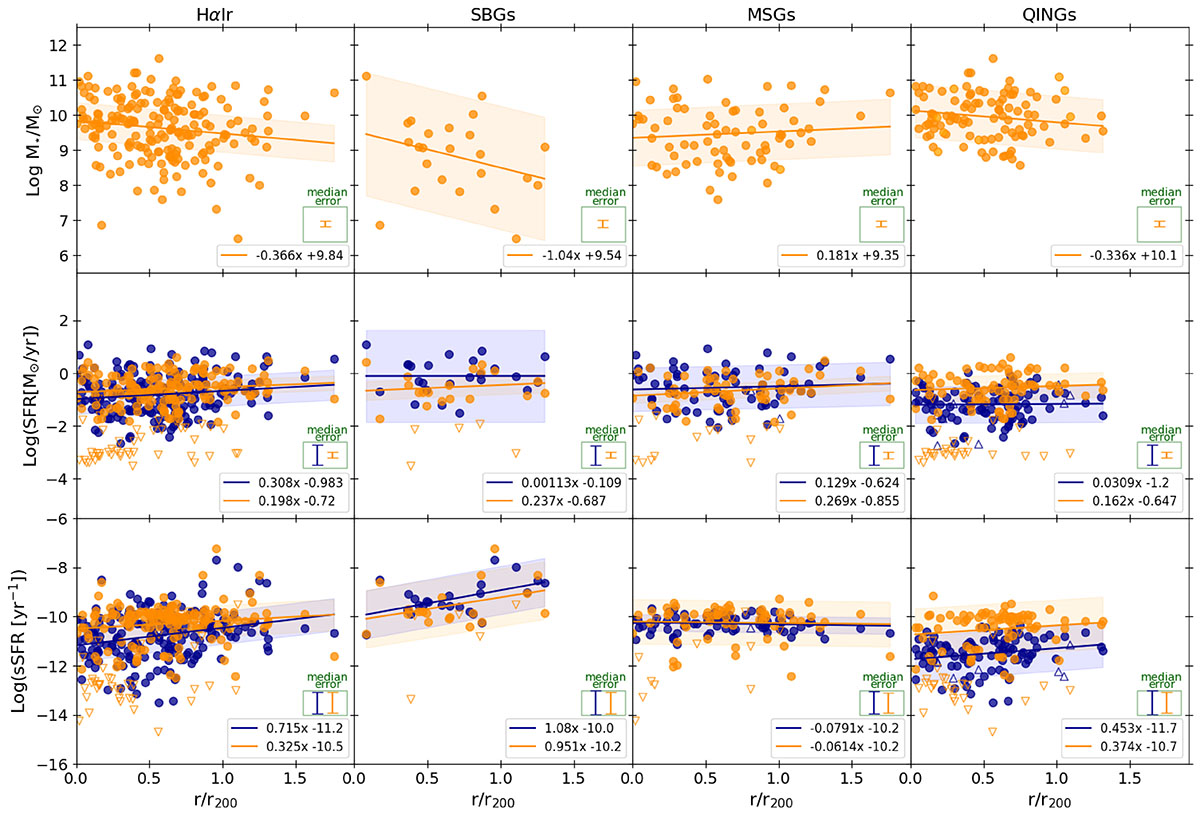
From top to bottom and left to right: Variation of M★, SFR, and sSFR for the HαIR sample, SBGs, MSGs, and QINGs. Blue indicates Hα measurements, and orange, mIR measurements. The legends contain the fits of the clouds, performed out to r/r200 = 1.25, since the sample is incomplete beyond that radius. The shaded areas are the 3σ error of the regressions. The errorbars represent the median errors of the measurements (blue from Hα and orange from mIR) of M★, SFR, and sSFR for the populations considered in each column.
Current usage metrics show cumulative count of Article Views (full-text article views including HTML views, PDF and ePub downloads, according to the available data) and Abstracts Views on Vision4Press platform.
Data correspond to usage on the plateform after 2015. The current usage metrics is available 48-96 hours after online publication and is updated daily on week days.
Initial download of the metrics may take a while.